

Question: Computer Assignment #1: Rail Distance and Transportation Times Problem . Use DATA ANALYSIS in EXCEL and R (via SHINY Interface) to analyze the Rail Distance
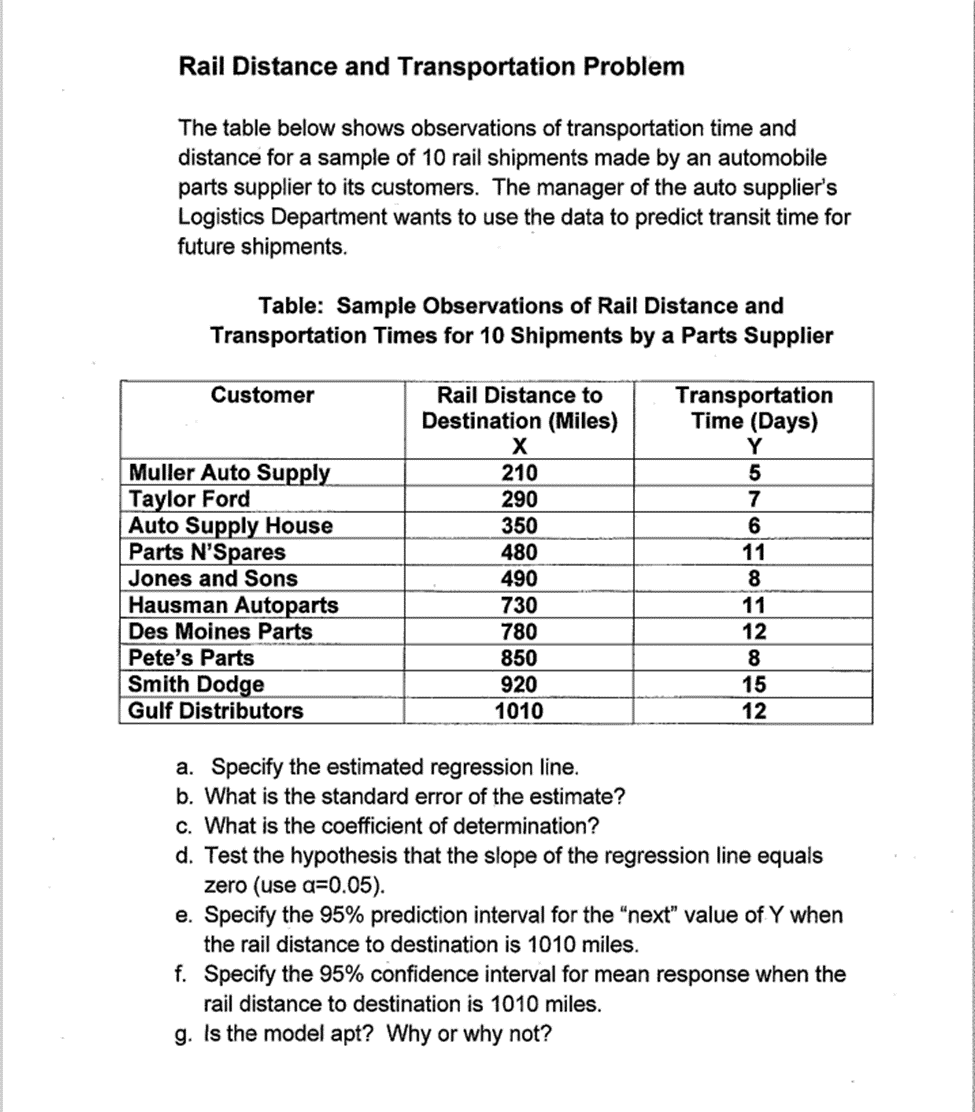
Computer Assignment #1: Rail Distance and Transportation Times Problem . Use DATA ANALYSIS in EXCEL and \"R" (via SHINY Interface) to analyze the Rail Distance and Transportation Times problem. The data and assignment questions are given on the following page. Provide the following analyses in EXCEL: * A scatter plot of the dependent and independent variables. Standard Regression Output including the estimated regression function, an ANOVA table, and residual output. A scatter plot of the standardized residuals and predicted Y (fitted Y) Conduct the following analyses in \"R\" (via SHINY Interface) and cut and paste the results into your EXCEL spreadsheet. + 95% confidence intervals for mean response and 95% prediction intervals for the \"next\" value of Y The three model tests: Breusch-Pagan, Lilliefors, and Durbin-Watson D. Rail Distance and Transportation Problem The table below shows observations of transportation time and distance for a sample of 10 rail shipments made by an automobile parts supplier to its customers. The manager of the auto supplier's Logistics Department wants to use the data to predict transit time for future shipments. Table: Sample Observations of Rail Distance and Transportation Times for 10 Shipments by a Parts Supplier ~ Rail Distance to Destination (Miles) X Customer Transportation Time (Days) Y Muller Auto Supply TaylorFord Auto Supply House Parts N'S Jones and Sons 8 Hausman Autoparts 11 Des Moines Parts 12 Pete's Parts 8 Smith Dodge . 15 Gulf Distributors | 12 a. Specify the estimated regression line. b. What is the standard error of the estimate? c. What is the coefficient of determination? d. Test the hypothesis that the slope of the regression line equals zero (use a=0.05). e. Specify the 95% prediction interval for the \"next\" value of Y when the rail distance to destination is 1010 miles. f. Specify the 95% confidence interval for mean response when the rail distance to destination is 1010 miles. g. Is the model apt? Why or why not
Step by Step Solution
There are 3 Steps involved in it
To solve the Rail Distance and Transportation Times problem follow these steps Step 1 Enter Data in ... View full answer

Get step-by-step solutions from verified subject matter experts