

Question: Computing and Interpreting Key Ratios Assume the data presented below are from the financial statements of JetBlue and Southwest Airlines. ($ millions) Jet Blue Airways
Computing and Interpreting Key Ratios
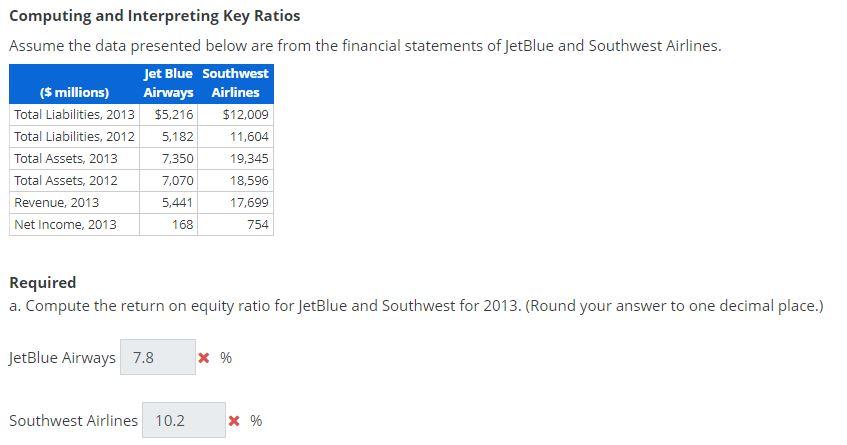
Assume the data presented below are from the financial statements of JetBlue and Southwest Airlines.
| ($ millions) | Jet Blue Airways | Southwest Airlines |
|---|---|---|
| Total Liabilities, 2013 | $5,216 | $12,009 |
| Total Liabilities, 2012 | 5,182 | 11,604 |
| Total Assets, 2013 | 7,350 | 19,345 |
| Total Assets, 2012 | 7,070 | 18,596 |
| Revenue, 2013 | 5,441 | 17,699 |
| Net Income, 2013 | 168 | 754 |
Required a. Compute the return on equity ratio for JetBlue and Southwest for 2013. (Round your answer to one decimal place.)
Computing and Interpreting Key Ratios Assume the data presented below are from the financial statements of JetBlue and Southwest Airlines. Jet Blue Southwest ($ millions) Airways Airlines Total Liabilities, 2013 $5,216 $12,009 Total Liabilities, 2012 5,182 11,604 Total Assets, 2013 7,350 19,345 Total Assets, 2012 7,070 18.596 Revenue, 2013 17,699 Net Income, 2013 754 5,441 168 Required a. Compute the return on equity ratio for JetBlue and Southwest for 2013. (Round your answer to one decimal place.) JetBlue Airways 7.8 X % Southwest Airlines 10.2 X %
Step by Step Solution
There are 3 Steps involved in it

Get step-by-step solutions from verified subject matter experts