

Question: computing and statistics Q2- using R studio 2. A graduate engineer at the famous Brunel Cola factory believes that the amount of cola produced by
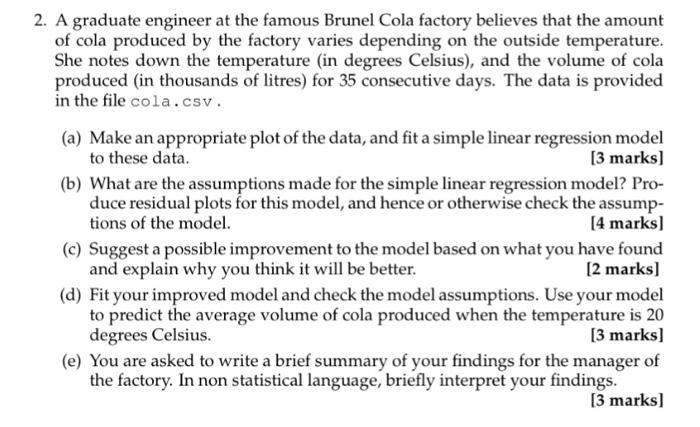
2. A graduate engineer at the famous Brunel Cola factory believes that the amount of cola produced by the factory varies depending on the outside temperature. She notes down the temperature (in degrees Celsius), and the volume of cola produced (in thousands of litres) for 35 consecutive days. The data is provided in the file cola.csv. (a) Make an appropriate plot of the data, and fit a simple linear regression model to these data. [3 marks] (b) What are the assumptions made for the simple linear regression model? Pro- duce residual plots for this model, and hence or otherwise check the assump- tions of the model. [4 marks) (c) Suggest a possible improvement to the model based on what you have found and explain why you think it will be better. [2 marks] (d) Fit your improved model and check the model assumptions. Use your model to predict the average volume of cola produced when the temperature is 20 degrees Celsius. [3 marks) (e) You are asked to write a brief summary of your findings for the manager of the factory. In non statistical language, briefly interpret your findings. [3 marks] 2. A graduate engineer at the famous Brunel Cola factory believes that the amount of cola produced by the factory varies depending on the outside temperature. She notes down the temperature (in degrees Celsius), and the volume of cola produced (in thousands of litres) for 35 consecutive days. The data is provided in the file cola.csv. (a) Make an appropriate plot of the data, and fit a simple linear regression model to these data. [3 marks] (b) What are the assumptions made for the simple linear regression model? Pro- duce residual plots for this model, and hence or otherwise check the assump- tions of the model. [4 marks) (c) Suggest a possible improvement to the model based on what you have found and explain why you think it will be better. [2 marks] (d) Fit your improved model and check the model assumptions. Use your model to predict the average volume of cola produced when the temperature is 20 degrees Celsius. [3 marks) (e) You are asked to write a brief summary of your findings for the manager of the factory. In non statistical language, briefly interpret your findings. [3 marks]
Step by Step Solution
There are 3 Steps involved in it

Get step-by-step solutions from verified subject matter experts