

Exhibit MC16.2 shows key financial data for Apple and BlackBerry for the three fiscal years 20102012. A
Fantastic news! We've Found the answer you've been seeking!
Question:
Exhibit MC16.2 shows key financial data for Apple and BlackBerry for the three fiscal years 2010–2012. A strategic financial analysis (SFA) for this MiniCase is available on Connect.
Reference Exhibit-MC 16.2
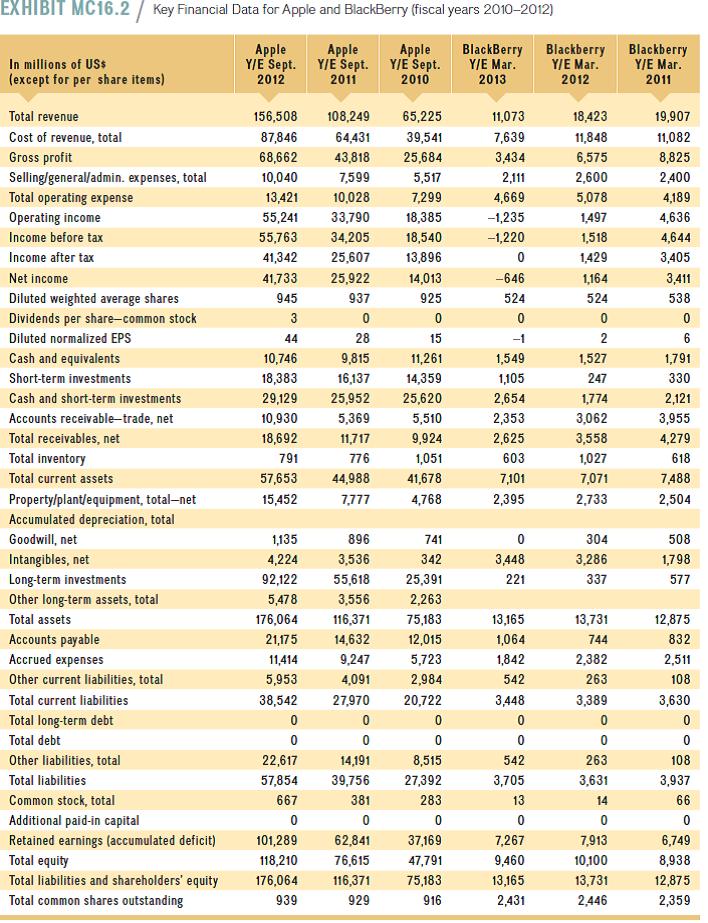
Conduct a dynamic firm profitability analysis over time (fiscal years 2008–2012) as shown in Exhibit MC16.2. Can you find signs of performance differentials between these two firms that may have indicated problems at BlackBerry? When did Black- Berry’s performance problems become apparent?
Transcribed Image Text:
EXHIBIT MC16.2 / Key Financial Data for Apple and BlackBerry (fiscal years 2010-2012) Аpple Y/E Sept. Y/E Sept. Y/E Sept. 2011 Blackberry Y/E Mar. Apple Apple In millions of US$ (except for per share items) BlackBerry Y/E Mar. 2013 Blackberry Y/E Mar. 2012 2010 2012 2011 Total revenue 156,508 108,249 65,225 11,073 18,423 19,907 Cost of revenue, total 87,846 64,431 39,541 7,639 11,848 11,082 Gross profit 68,662 43,818 25,684 3,434 6,575 8,825 Selling/general/admin. expenses, total 10,040 7,599 5,517 2,111 2,600 2,400 13,421 4,669 Total operating expense Operating income 10,028 7,299 5,078 4,189 55,241 33,790 18,385 -1,235 1,497 4,636 Income before tax 55,763 34,205 18,540 -1,220 1,518 4,644 Income after tax 41,342 25,607 13,896 1,429 3,405 Net income 41,733 25,922 14,013 -646 1,164 3,411 Diluted weighted average shares 945 937 925 524 524 538 Dividends per share-common stock 3 Diluted normalized EPS 44 28 15 -1 Cash and equivalents 10,746 9,815 11,261 1,549 1,527 1,791 Short-term investments 18,383 16,137 14,359 1,105 247 330 Cash and short-term investments 29,129 25,952 25,620 2,654 1,774 2,121 Accounts receivable-trade, net 10,930 5,369 5,510 2,353 3,062 3,955 Total receivables, net 18,692 11,717 9,924 2,625 3,558 4,279 Total inventory 791 776 1,051 603 1,027 618 Total current assets 57,653 44,988 41,678 7,101 7,071 7488 Property/plant/equipment, total-net 15,452 7,777 4,768 2,395 2,733 2,504 Accumulated depreciation, total Goodwill, net 1,135 896 741 304 508 Intangibles, net 4,224 3,536 342 3,448 3,286 1,798 Long-term investments 92,122 55,618 25,391 221 337 577 Other long-term assets, total 5,478 3,556 2,263 Total assets 176,064 116,371 75,183 13,165 13,731 12,875 12,015 Accounts payable Accrued expenses 21,175 14,632 1,064 744 832 11,414 9,247 5,723 1,842 2,382 2,511 Other current liabilities, total 5,953 4,091 2,984 542 263 108 Total current liabilities 38,542 27,970 20,722 3,448 3,389 3,630 Total long-term debt Total debt Other liabilities, total 22,617 14,191 8,515 542 263 108 Total liabilities 57,854 39,756 27,392 3,705 3,631 3,937 Common stock, total 667 381 283 13 14 66 Additional paid-in capital Retained earnings (accumulated deficit) Total equity 101,289 62,841 37,169 7,267 7,913 6,749 118,210 76,615 47,791 9,460 10,100 8,938 Total liabilities and shareholders' equity Total common shares outstanding 176,064 116,371 75,183 13,165 13,731 12,875 939 929 916 2,431 2,446 2,359 EXHIBIT MC16.2 / Key Financial Data for Apple and BlackBerry (fiscal years 2010-2012) Аpple Y/E Sept. Y/E Sept. Y/E Sept. 2011 Blackberry Y/E Mar. Apple Apple In millions of US$ (except for per share items) BlackBerry Y/E Mar. 2013 Blackberry Y/E Mar. 2012 2010 2012 2011 Total revenue 156,508 108,249 65,225 11,073 18,423 19,907 Cost of revenue, total 87,846 64,431 39,541 7,639 11,848 11,082 Gross profit 68,662 43,818 25,684 3,434 6,575 8,825 Selling/general/admin. expenses, total 10,040 7,599 5,517 2,111 2,600 2,400 13,421 4,669 Total operating expense Operating income 10,028 7,299 5,078 4,189 55,241 33,790 18,385 -1,235 1,497 4,636 Income before tax 55,763 34,205 18,540 -1,220 1,518 4,644 Income after tax 41,342 25,607 13,896 1,429 3,405 Net income 41,733 25,922 14,013 -646 1,164 3,411 Diluted weighted average shares 945 937 925 524 524 538 Dividends per share-common stock 3 Diluted normalized EPS 44 28 15 -1 Cash and equivalents 10,746 9,815 11,261 1,549 1,527 1,791 Short-term investments 18,383 16,137 14,359 1,105 247 330 Cash and short-term investments 29,129 25,952 25,620 2,654 1,774 2,121 Accounts receivable-trade, net 10,930 5,369 5,510 2,353 3,062 3,955 Total receivables, net 18,692 11,717 9,924 2,625 3,558 4,279 Total inventory 791 776 1,051 603 1,027 618 Total current assets 57,653 44,988 41,678 7,101 7,071 7488 Property/plant/equipment, total-net 15,452 7,777 4,768 2,395 2,733 2,504 Accumulated depreciation, total Goodwill, net 1,135 896 741 304 508 Intangibles, net 4,224 3,536 342 3,448 3,286 1,798 Long-term investments 92,122 55,618 25,391 221 337 577 Other long-term assets, total 5,478 3,556 2,263 Total assets 176,064 116,371 75,183 13,165 13,731 12,875 12,015 Accounts payable Accrued expenses 21,175 14,632 1,064 744 832 11,414 9,247 5,723 1,842 2,382 2,511 Other current liabilities, total 5,953 4,091 2,984 542 263 108 Total current liabilities 38,542 27,970 20,722 3,448 3,389 3,630 Total long-term debt Total debt Other liabilities, total 22,617 14,191 8,515 542 263 108 Total liabilities 57,854 39,756 27,392 3,705 3,631 3,937 Common stock, total 667 381 283 13 14 66 Additional paid-in capital Retained earnings (accumulated deficit) Total equity 101,289 62,841 37,169 7,267 7,913 6,749 118,210 76,615 47,791 9,460 10,100 8,938 Total liabilities and shareholders' equity Total common shares outstanding 176,064 116,371 75,183 13,165 13,731 12,875 939 929 916 2,431 2,446 2,359 EXHIBIT MC16.2 / Key Financial Data for Apple and BlackBerry (fiscal years 2010-2012) Аpple Y/E Sept. Y/E Sept. Y/E Sept. 2011 Blackberry Y/E Mar. Apple Apple In millions of US$ (except for per share items) BlackBerry Y/E Mar. 2013 Blackberry Y/E Mar. 2012 2010 2012 2011 Total revenue 156,508 108,249 65,225 11,073 18,423 19,907 Cost of revenue, total 87,846 64,431 39,541 7,639 11,848 11,082 Gross profit 68,662 43,818 25,684 3,434 6,575 8,825 Selling/general/admin. expenses, total 10,040 7,599 5,517 2,111 2,600 2,400 13,421 4,669 Total operating expense Operating income 10,028 7,299 5,078 4,189 55,241 33,790 18,385 -1,235 1,497 4,636 Income before tax 55,763 34,205 18,540 -1,220 1,518 4,644 Income after tax 41,342 25,607 13,896 1,429 3,405 Net income 41,733 25,922 14,013 -646 1,164 3,411 Diluted weighted average shares 945 937 925 524 524 538 Dividends per share-common stock 3 Diluted normalized EPS 44 28 15 -1 Cash and equivalents 10,746 9,815 11,261 1,549 1,527 1,791 Short-term investments 18,383 16,137 14,359 1,105 247 330 Cash and short-term investments 29,129 25,952 25,620 2,654 1,774 2,121 Accounts receivable-trade, net 10,930 5,369 5,510 2,353 3,062 3,955 Total receivables, net 18,692 11,717 9,924 2,625 3,558 4,279 Total inventory 791 776 1,051 603 1,027 618 Total current assets 57,653 44,988 41,678 7,101 7,071 7488 Property/plant/equipment, total-net 15,452 7,777 4,768 2,395 2,733 2,504 Accumulated depreciation, total Goodwill, net 1,135 896 741 304 508 Intangibles, net 4,224 3,536 342 3,448 3,286 1,798 Long-term investments 92,122 55,618 25,391 221 337 577 Other long-term assets, total 5,478 3,556 2,263 Total assets 176,064 116,371 75,183 13,165 13,731 12,875 12,015 Accounts payable Accrued expenses 21,175 14,632 1,064 744 832 11,414 9,247 5,723 1,842 2,382 2,511 Other current liabilities, total 5,953 4,091 2,984 542 263 108 Total current liabilities 38,542 27,970 20,722 3,448 3,389 3,630 Total long-term debt Total debt Other liabilities, total 22,617 14,191 8,515 542 263 108 Total liabilities 57,854 39,756 27,392 3,705 3,631 3,937 Common stock, total 667 381 283 13 14 66 Additional paid-in capital Retained earnings (accumulated deficit) Total equity 101,289 62,841 37,169 7,267 7,913 6,749 118,210 76,615 47,791 9,460 10,100 8,938 Total liabilities and shareholders' equity Total common shares outstanding 176,064 116,371 75,183 13,165 13,731 12,875 939 929 916 2,431 2,446 2,359 EXHIBIT MC16.2 / Key Financial Data for Apple and BlackBerry (fiscal years 2010-2012) Аpple Y/E Sept. Y/E Sept. Y/E Sept. 2011 Blackberry Y/E Mar. Apple Apple In millions of US$ (except for per share items) BlackBerry Y/E Mar. 2013 Blackberry Y/E Mar. 2012 2010 2012 2011 Total revenue 156,508 108,249 65,225 11,073 18,423 19,907 Cost of revenue, total 87,846 64,431 39,541 7,639 11,848 11,082 Gross profit 68,662 43,818 25,684 3,434 6,575 8,825 Selling/general/admin. expenses, total 10,040 7,599 5,517 2,111 2,600 2,400 13,421 4,669 Total operating expense Operating income 10,028 7,299 5,078 4,189 55,241 33,790 18,385 -1,235 1,497 4,636 Income before tax 55,763 34,205 18,540 -1,220 1,518 4,644 Income after tax 41,342 25,607 13,896 1,429 3,405 Net income 41,733 25,922 14,013 -646 1,164 3,411 Diluted weighted average shares 945 937 925 524 524 538 Dividends per share-common stock 3 Diluted normalized EPS 44 28 15 -1 Cash and equivalents 10,746 9,815 11,261 1,549 1,527 1,791 Short-term investments 18,383 16,137 14,359 1,105 247 330 Cash and short-term investments 29,129 25,952 25,620 2,654 1,774 2,121 Accounts receivable-trade, net 10,930 5,369 5,510 2,353 3,062 3,955 Total receivables, net 18,692 11,717 9,924 2,625 3,558 4,279 Total inventory 791 776 1,051 603 1,027 618 Total current assets 57,653 44,988 41,678 7,101 7,071 7488 Property/plant/equipment, total-net 15,452 7,777 4,768 2,395 2,733 2,504 Accumulated depreciation, total Goodwill, net 1,135 896 741 304 508 Intangibles, net 4,224 3,536 342 3,448 3,286 1,798 Long-term investments 92,122 55,618 25,391 221 337 577 Other long-term assets, total 5,478 3,556 2,263 Total assets 176,064 116,371 75,183 13,165 13,731 12,875 12,015 Accounts payable Accrued expenses 21,175 14,632 1,064 744 832 11,414 9,247 5,723 1,842 2,382 2,511 Other current liabilities, total 5,953 4,091 2,984 542 263 108 Total current liabilities 38,542 27,970 20,722 3,448 3,389 3,630 Total long-term debt Total debt Other liabilities, total 22,617 14,191 8,515 542 263 108 Total liabilities 57,854 39,756 27,392 3,705 3,631 3,937 Common stock, total 667 381 283 13 14 66 Additional paid-in capital Retained earnings (accumulated deficit) Total equity 101,289 62,841 37,169 7,267 7,913 6,749 118,210 76,615 47,791 9,460 10,100 8,938 Total liabilities and shareholders' equity Total common shares outstanding 176,064 116,371 75,183 13,165 13,731 12,875 939 929 916 2,431 2,446 2,359 EXHIBIT MC16.2 / Key Financial Data for Apple and BlackBerry (fiscal years 2010-2012) Аpple Y/E Sept. Y/E Sept. Y/E Sept. 2011 Blackberry Y/E Mar. Apple Apple In millions of US$ (except for per share items) BlackBerry Y/E Mar. 2013 Blackberry Y/E Mar. 2012 2010 2012 2011 Total revenue 156,508 108,249 65,225 11,073 18,423 19,907 Cost of revenue, total 87,846 64,431 39,541 7,639 11,848 11,082 Gross profit 68,662 43,818 25,684 3,434 6,575 8,825 Selling/general/admin. expenses, total 10,040 7,599 5,517 2,111 2,600 2,400 13,421 4,669 Total operating expense Operating income 10,028 7,299 5,078 4,189 55,241 33,790 18,385 -1,235 1,497 4,636 Income before tax 55,763 34,205 18,540 -1,220 1,518 4,644 Income after tax 41,342 25,607 13,896 1,429 3,405 Net income 41,733 25,922 14,013 -646 1,164 3,411 Diluted weighted average shares 945 937 925 524 524 538 Dividends per share-common stock 3 Diluted normalized EPS 44 28 15 -1 Cash and equivalents 10,746 9,815 11,261 1,549 1,527 1,791 Short-term investments 18,383 16,137 14,359 1,105 247 330 Cash and short-term investments 29,129 25,952 25,620 2,654 1,774 2,121 Accounts receivable-trade, net 10,930 5,369 5,510 2,353 3,062 3,955 Total receivables, net 18,692 11,717 9,924 2,625 3,558 4,279 Total inventory 791 776 1,051 603 1,027 618 Total current assets 57,653 44,988 41,678 7,101 7,071 7488 Property/plant/equipment, total-net 15,452 7,777 4,768 2,395 2,733 2,504 Accumulated depreciation, total Goodwill, net 1,135 896 741 304 508 Intangibles, net 4,224 3,536 342 3,448 3,286 1,798 Long-term investments 92,122 55,618 25,391 221 337 577 Other long-term assets, total 5,478 3,556 2,263 Total assets 176,064 116,371 75,183 13,165 13,731 12,875 12,015 Accounts payable Accrued expenses 21,175 14,632 1,064 744 832 11,414 9,247 5,723 1,842 2,382 2,511 Other current liabilities, total 5,953 4,091 2,984 542 263 108 Total current liabilities 38,542 27,970 20,722 3,448 3,389 3,630 Total long-term debt Total debt Other liabilities, total 22,617 14,191 8,515 542 263 108 Total liabilities 57,854 39,756 27,392 3,705 3,631 3,937 Common stock, total 667 381 283 13 14 66 Additional paid-in capital Retained earnings (accumulated deficit) Total equity 101,289 62,841 37,169 7,267 7,913 6,749 118,210 76,615 47,791 9,460 10,100 8,938 Total liabilities and shareholders' equity Total common shares outstanding 176,064 116,371 75,183 13,165 13,731 12,875 939 929 916 2,431 2,446 2,359 EXHIBIT MC16.2 / Key Financial Data for Apple and BlackBerry (fiscal years 2010-2012) Аpple Y/E Sept. Y/E Sept. Y/E Sept. 2011 Blackberry Y/E Mar. Apple Apple In millions of US$ (except for per share items) BlackBerry Y/E Mar. 2013 Blackberry Y/E Mar. 2012 2010 2012 2011 Total revenue 156,508 108,249 65,225 11,073 18,423 19,907 Cost of revenue, total 87,846 64,431 39,541 7,639 11,848 11,082 Gross profit 68,662 43,818 25,684 3,434 6,575 8,825 Selling/general/admin. expenses, total 10,040 7,599 5,517 2,111 2,600 2,400 13,421 4,669 Total operating expense Operating income 10,028 7,299 5,078 4,189 55,241 33,790 18,385 -1,235 1,497 4,636 Income before tax 55,763 34,205 18,540 -1,220 1,518 4,644 Income after tax 41,342 25,607 13,896 1,429 3,405 Net income 41,733 25,922 14,013 -646 1,164 3,411 Diluted weighted average shares 945 937 925 524 524 538 Dividends per share-common stock 3 Diluted normalized EPS 44 28 15 -1 Cash and equivalents 10,746 9,815 11,261 1,549 1,527 1,791 Short-term investments 18,383 16,137 14,359 1,105 247 330 Cash and short-term investments 29,129 25,952 25,620 2,654 1,774 2,121 Accounts receivable-trade, net 10,930 5,369 5,510 2,353 3,062 3,955 Total receivables, net 18,692 11,717 9,924 2,625 3,558 4,279 Total inventory 791 776 1,051 603 1,027 618 Total current assets 57,653 44,988 41,678 7,101 7,071 7488 Property/plant/equipment, total-net 15,452 7,777 4,768 2,395 2,733 2,504 Accumulated depreciation, total Goodwill, net 1,135 896 741 304 508 Intangibles, net 4,224 3,536 342 3,448 3,286 1,798 Long-term investments 92,122 55,618 25,391 221 337 577 Other long-term assets, total 5,478 3,556 2,263 Total assets 176,064 116,371 75,183 13,165 13,731 12,875 12,015 Accounts payable Accrued expenses 21,175 14,632 1,064 744 832 11,414 9,247 5,723 1,842 2,382 2,511 Other current liabilities, total 5,953 4,091 2,984 542 263 108 Total current liabilities 38,542 27,970 20,722 3,448 3,389 3,630 Total long-term debt Total debt Other liabilities, total 22,617 14,191 8,515 542 263 108 Total liabilities 57,854 39,756 27,392 3,705 3,631 3,937 Common stock, total 667 381 283 13 14 66 Additional paid-in capital Retained earnings (accumulated deficit) Total equity 101,289 62,841 37,169 7,267 7,913 6,749 118,210 76,615 47,791 9,460 10,100 8,938 Total liabilities and shareholders' equity Total common shares outstanding 176,064 116,371 75,183 13,165 13,731 12,875 939 929 916 2,431 2,446 2,359
Expert Answer:
Answer rating: 100% (QA)
From the figures above its clear that Apple was already seeing consistent gro... View the full answer

Related Book For 
International Business and the New Realities
ISBN: 978-0136090984
2nd Edition
Authors: S. Tamer Cavusgil, Gary Knight, John R. Riesenberger
Posted Date:
Students also viewed these finance questions
-
In problems 1-6, find the indicated limit. 1. 2. 3. 4. 5. 6. lim (x 5) lim (1 2) lim (2x 1) lim(822t-1) lim (t-1 lim (t-x
-
In problems 1-5, find the indicated limit or state that it does not exist. 1. 2. 3. 4. 5. r2 ma x + 2 1 1 lim
-
In Problems 1-3, find the indicated limit or state that it does not exist. 1. 2. 3. lim (xyx3y2) lim (r,y)(12) y-2x2 x + y lim
-
A student adds NBS to a solution of 1-methylcyclohexene and irradiates the mixture with a sunlamp until all the NBS has reacted. After a careful distillation, the product mixture contains two major...
-
What was the content of Latin American trade reforms of the late 1980s and 1990s? How do the actions taken relate to the desired goals?
-
A Federal Reserve Board Report looked at how consumers are using mobile devices throughout their purchase journey. In response to a survey question about mobile device use while shopping, 47% of...
-
What is the operating temperature for an evacuated tube collector operating at \(50 \%\) efficiency if the insolation is \(800 \mathrm{~W} / \mathrm{m}^{2}\) ? Use data from Figure 7.19. Figure 7.19...
-
The Monteiro Manufacturing Corporation manufactures and sells folding umbrellas. The corporation's condensed income statement for the year ended December 31, 2011, follows: Monteiro's budget...
-
You are driving your car at a speed of 35.0 m/s and you hit the brakes slowing to 20.0 m/s. If it takes 4.50 s to slow down (a) Determine the acceleration of the car. (b) Determine the displacement...
-
Consider the operations of a fast-food restaurant serving pre-made pasta dishes to its guests. The operation consists of four steps. Each customer is first greeted and offered a menu and a tray,...
-
(10pts) Consider the surface o which is parameterized by r(u, v)=(1+u cos(v), 1+u sin(v),u) for -1u1 & 0v27 which is depicted below. Suppose the density at any point ono is given by the function f(x,...
-
The Shirt Shop had the following transactions for T - shirts for Year 1 , its first year of operations: January 2 0 Purchased 3 3 0 units @ $ 7 = $ 2 , 3 1 0 April 2 1 Purchased 1 5 0 units @ $ 8 = 1...
-
Silver Company makes a product that is very popular as a Mother s Day gift. Thus, peak sales occur in May of each year, as shown in the company s sales budget for the second quarter given below:...
-
Ryan Corporation manufactures auto steering systems. Prime cost and machine time estimates for one unit of the product for the year follow: Direct materials $ 2 6 0 Direct labor ( $ 1 8 / hour ) $ 4...
-
Solomon Bank's startup division establishes new branch banks. Each branch opens with three tellers. Total teller cost per branch is $ 1 0 0 , 0 0 0 per year. The three tellers combined can process up...
-
The following items are necessary for preparing the 2 0 2 4 year - end adjustments for Rogers Advertising Agency. Rogers s fiscal year - end is December 3 1 . On July 1 , 2 0 2 4 , Rogers received $...
-
Management functions would not be complete without the activities of the human resource department. Important to the function of the organization is the human resource management activities. It is...
-
A survey of 70 college freshmen asked whether students planned to take biology, chemistry, or physics during their first year. Use the diagram to answer each question. How many of the surveyed...
-
Differentiate between a free trade area and a customs union. Differentiate between a customs union and a common market.
-
Global branding is key to international marketing success. Every year BusinessWeek and Interbrand publish a ranking of the top 100 global brands. The ranking can be accessed by searching the term...
-
1. What were Fords motives and objectives for entering its collaborative venture with Volkswagen? Evaluate the extent to which Ford accomplished these objectives. 2. What type of collaborative...
-
Edward has the following income in 2023-24: He makes a total of 800 of Gift Aid donations during 2023-24. Compute the amount of income tax payable for the year.
-
Susan is granted a 20-year lease on a property, paying a premium of 76,000. Explain how tax relief will be given in relation to this premium if: (a) she uses the property for trading purposes, or (b)...
-
In 2023-24, Victor rents out a room in his home and receives rents of 8,150. He incurs allowable expenses of 820. What "rent-a-room" elections (if any) should he make?

Study smarter with the SolutionInn App