

Question: Conduct a Financial Analysis using exhibit 7 (percent changes, percent of sale and select ratios) please complete in excel or easist way possible Exhibit 7
Conduct a Financial Analysis using exhibit 7 (percent changes, percent of sale and select ratios) please complete in excel or easist way possible
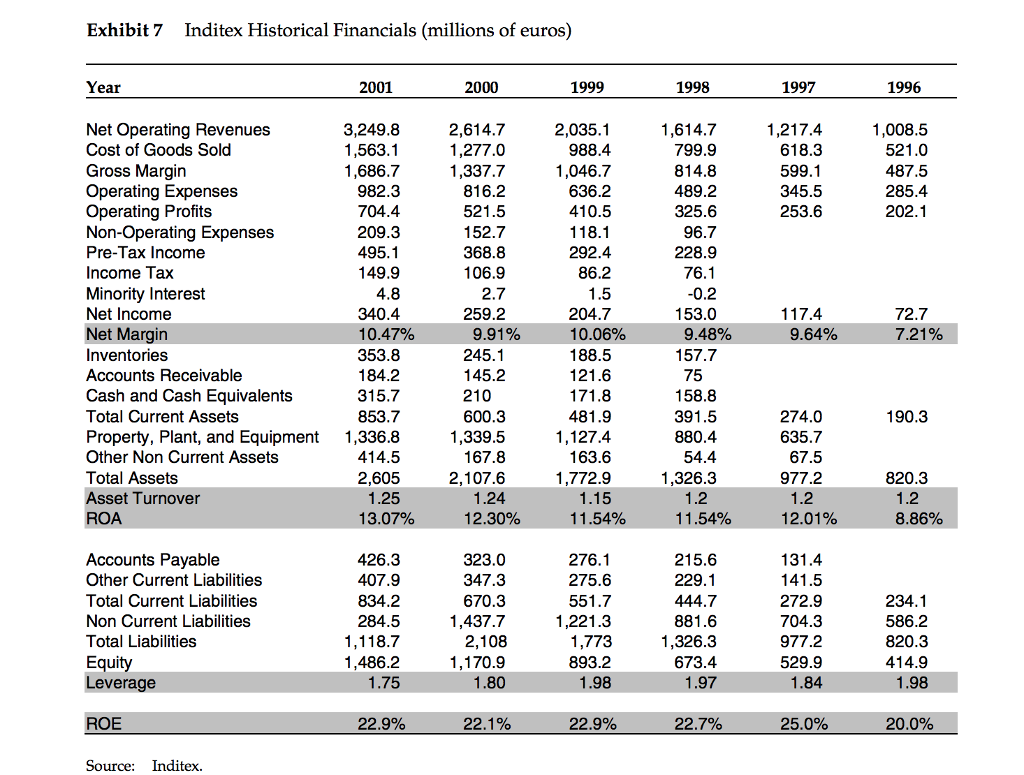
Exhibit 7 Inditex Historical Financials (millions of euros) Year 2001 1999 1998 1997 1996 3,249.8 1,563.1 1,686.7 982.3 704.4 209.3 495.1 149.9 2,614.7 1,277.0 1,337.7 816.2 1,008.5 521.0 487.5 285.4 202.1 2,035.1 988.4 1,046.7 636.2 Net Operating Revenues Cost of Goods Sold Gross Margin Operating Expenses Operating Profits Non-Operating Expenses Pre-Tax Income Income Tax Minority Interest Net Income Net Margin Inventories Accounts Receivable Cash and Cash Equivalents Total Current Assets Property, Plant, and Equipment 1,336.8 Other Non Current Assets Total Assets Asset T urnover ROA 799.9 599.1 345.5 253.6 489.2 152.7 368.8 106.9 292.4 204.7 10.06% 188.5 259.2 10.47% 353.8 184.2 9.48% 157.7 9.91% 7.21% 245.1 145.2 190.3 481.9 1,127.4 274.0 635.7 1,339.5 2,605 2,107.6 1,772.9 1,326.3 977.2 820.3 1.25 13.07% 12.30% 8.86% Accounts Payable Other Current Liabilities Total Current Liabilities Non Current Liabilities Total Liabilities 426.3 407.9 834.2 284.5 323.0 347.3 670.3 1,437.7 2,108 1,170.9 276.1 275.6 551.7 1,221.3 1,773 893.2 141.5 272.9 704.3 977.2 529.9 444.7 586.2 820.3 Ul 1,486.2 673.4 Leverage ROE Source: Inditex. 22.9% 227%
Step by Step Solution
There are 3 Steps involved in it

Get step-by-step solutions from verified subject matter experts