

Conduct financial analysis for Mattel for 2017, 2016, and 2015 using any six of the following financial
Fantastic news! We've Found the answer you've been seeking!
Question:
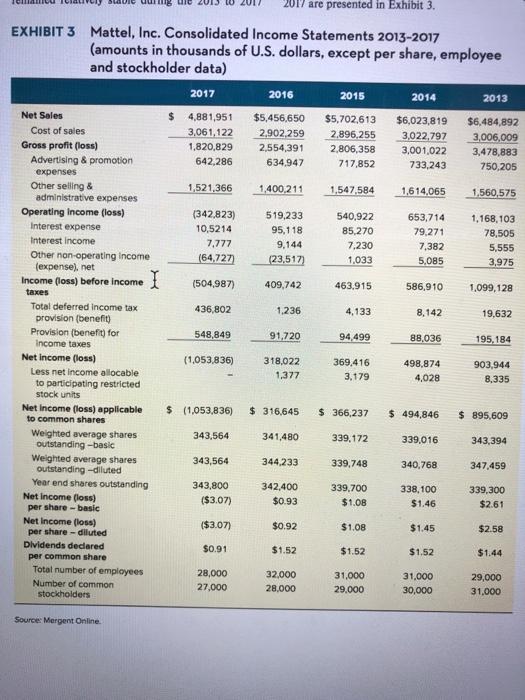
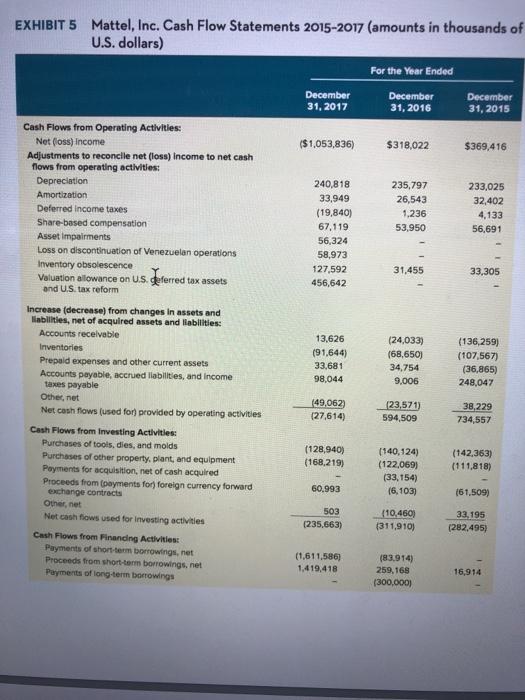
Conduct financial analysis for Mattel for 2017, 2016, and 2015 using any six of the following financial ratios:
the current ratio, return on equity, operating profit margin, coverage ratio, net profit margin, debt asset ratio, and debt to equity. show your work. tabulate your result.
Expert Answer:
To conduct a financial analysis for Mattel for the years 2017 2016 and 2015 we will use the following six financial ratios Current Ratio This ratio measures the companys ability to cover shortterm lia... View the full answer

Related Book For 
Using Microsoft Excel and Access 2016 for Accounting
ISBN: 978-1337109048
5th edition
Authors: Glenn Owen
Posted Date:
