

Question: The MINITAB commands will create a normal scores plot from observations that were set in C1. (MINITAB uses a variant of the normal scores, (m_{i}),
The MINITAB commands
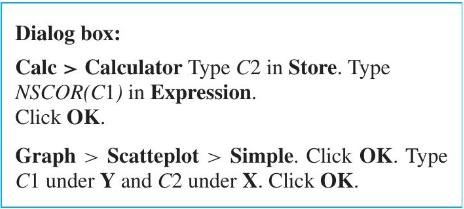
will create a normal scores plot from observations that were set in C1. (MINITAB uses a variant of the normal scores, \(m_{i}\), that we defined.) Construct a normal scores plot of
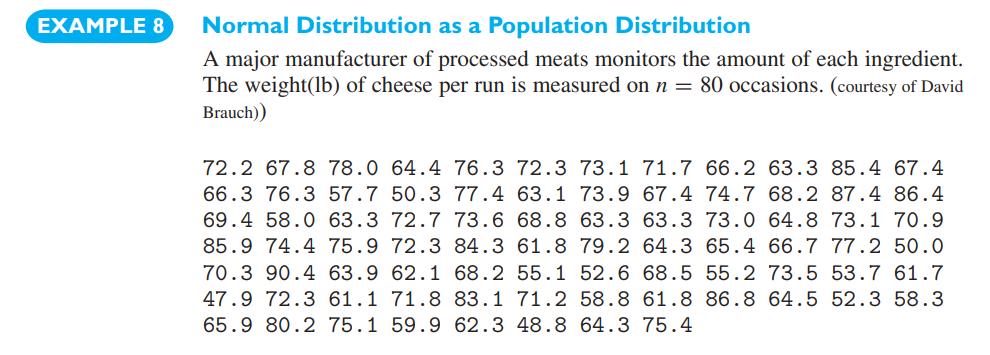
(a) the cheese data of Example 8,
(b) the decay time data on page 156.
Data From Example 8
Dialog box: Calc Calculator Type C2 in Store. Type NSCOR(C1) in Expression. Click OK. Graph Scatteplot > Simple. Click OK. Type Cl under Y and C2 under X. Click OK.
Step by Step Solution
There are 3 Steps involved in it
1 Expert Approved Answer
Step: 1 Unlock

Question Has Been Solved by an Expert!
Get step-by-step solutions from verified subject matter experts
Step: 2 Unlock
Step: 3 Unlock