

Question: Conduct a horizontal analysis by calculating the year-over-year changes in each line item, expressed in dollars and in percentages for the income statement of
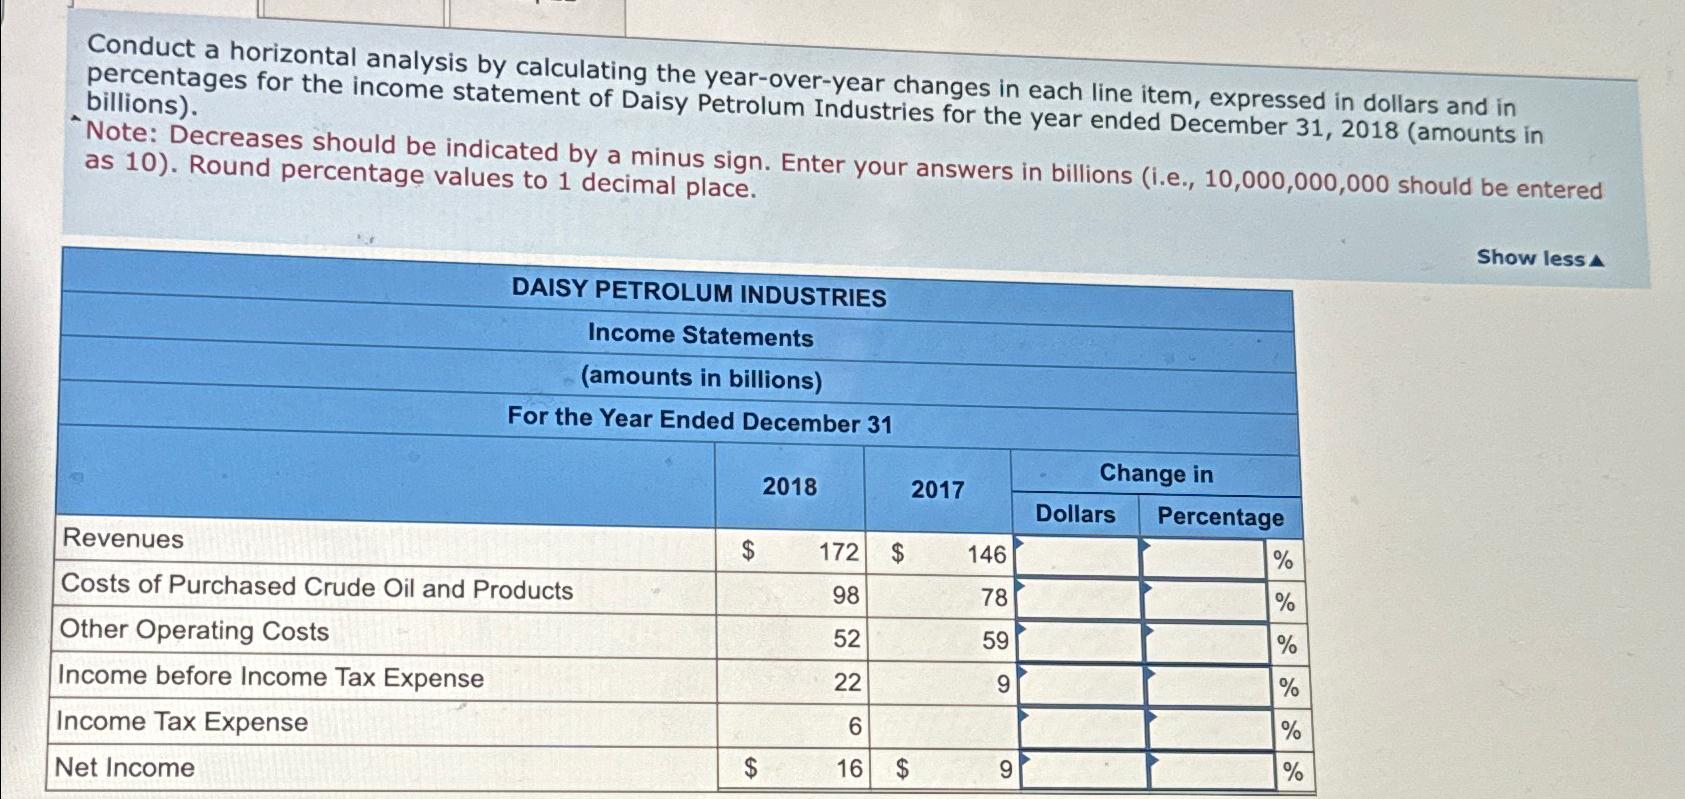
Conduct a horizontal analysis by calculating the year-over-year changes in each line item, expressed in dollars and in percentages for the income statement of Daisy Petrolum Industries for the year ended December 31, 2018 (amounts in billions). Note: Decreases should be indicated by a minus sign. Enter your answers in billions (i.e., 10,000,000,000 should be entered as 10). Round percentage values to 1 decimal place. DAISY PETROLUM INDUSTRIES Income Statements (amounts in billions) For the Year Ended December 31 2018 2017 Change in Dollars Percentage Revenues $ 172 $ 146 % Costs of Purchased Crude Oil and Products 98 78 200 % Other Operating Costs 52 59 100 % Income before Income Tax Expense 22 9 % Income Tax Expense 6 % Net Income $ 16 $ 9 % Show lessA
Step by Step Solution
There are 3 Steps involved in it

Get step-by-step solutions from verified subject matter experts