

Question: Conduct a regression analysis for the following data. Q2.1 Test the hypothesis that X is a good predictor of Y and explain why or why
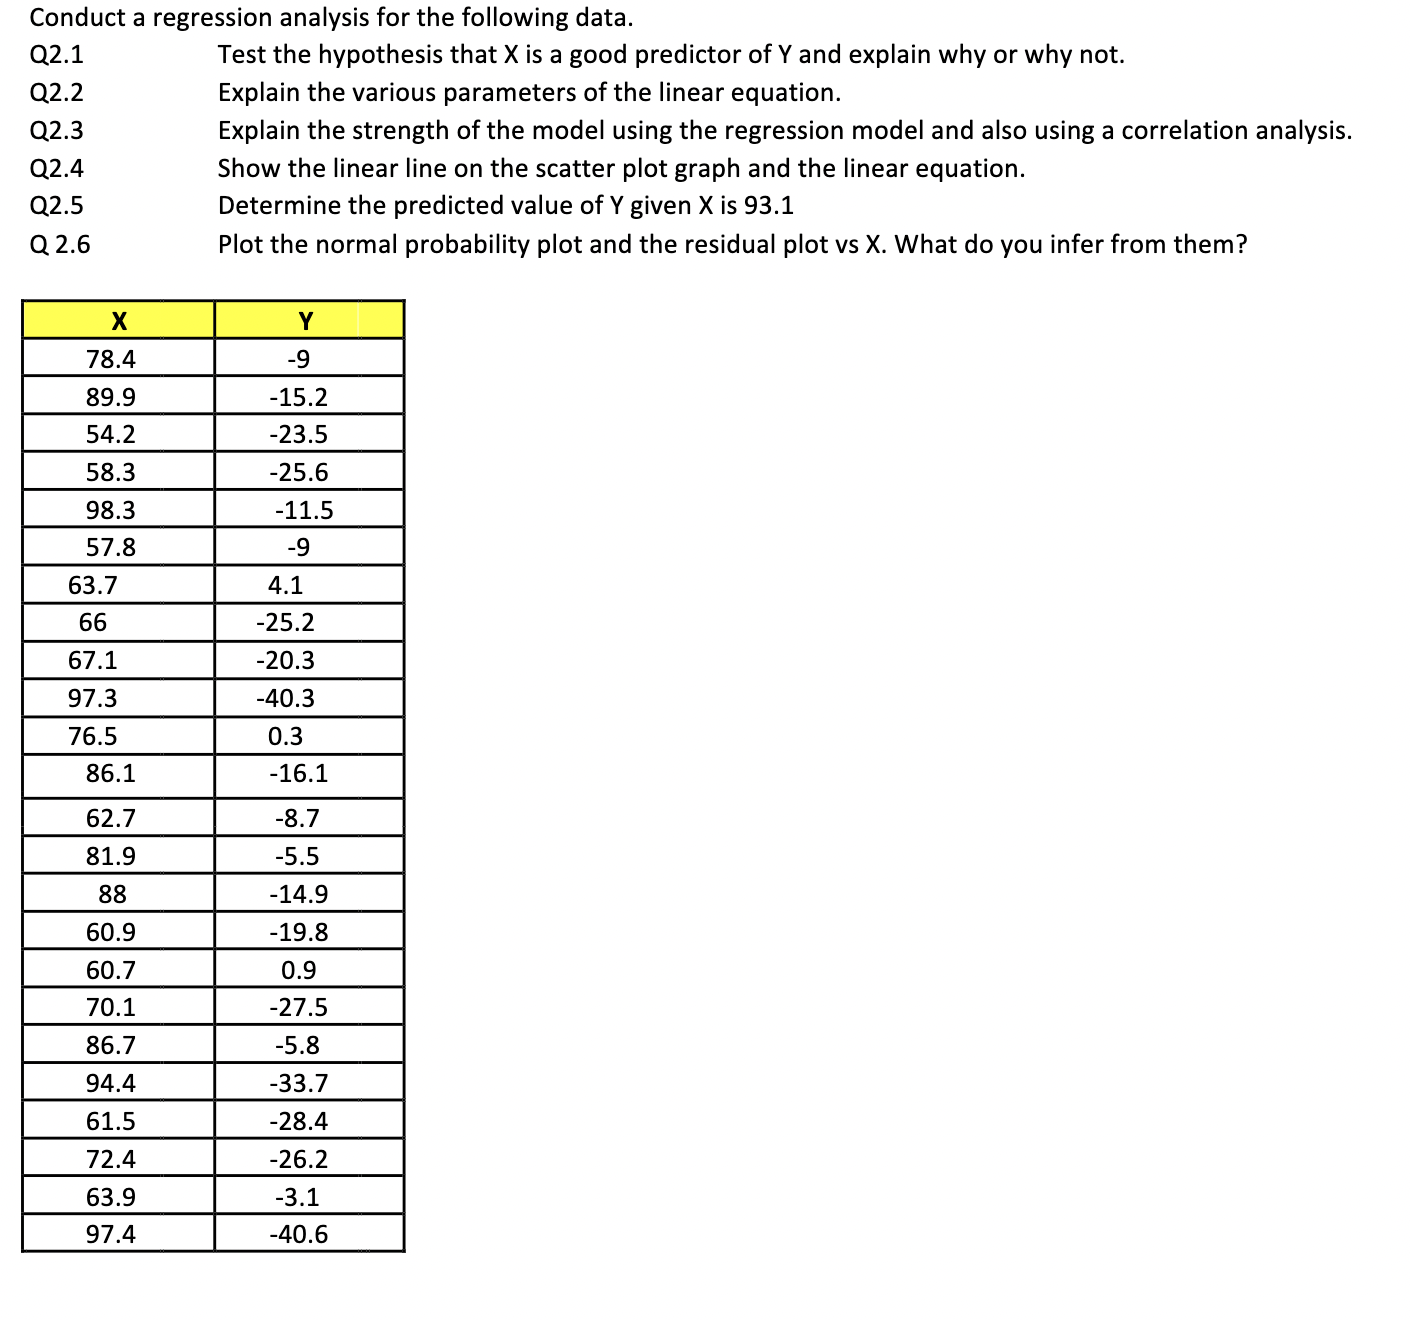
Conduct a regression analysis for the following data. Q2.1 Test the hypothesis that X is a good predictor of Y and explain why or why not. Q2.2 Explain the various parameters of the linear equation. Q2.3 Explain the strength of the model using the regression model and also using a correlation analysis. Q2.4 Show the linear line on the scatter plot graph and the linear equation. Q2.5 Determine the predicted value of Y given X is 93.1 Q 2.6 Plot the normal probability plot and the residual plot vs X. What do you infer from them? Conduct a regression analysis for the following data. Q2.1 Test the hypothesis that X is a good predictor of Y and explain why or why not. Q2.2 Explain the various parameters of the linear equation. Q2.3 Explain the strength of the model using the regression model and also using a correlation analysis. Q2.4 Show the linear line on the scatter plot graph and the linear equation. Q2.5 Determine the predicted value of Y given X is 93.1 Q 2.6 Plot the normal probability plot and the residual plot vs X. What do you infer from them
Step by Step Solution
There are 3 Steps involved in it

Get step-by-step solutions from verified subject matter experts