

Question: STATIMATH 1 F92 Assignment 2 2021-2022 e) Return to the scatter plot you created in part a). Draw the regression line on the scatter plot.
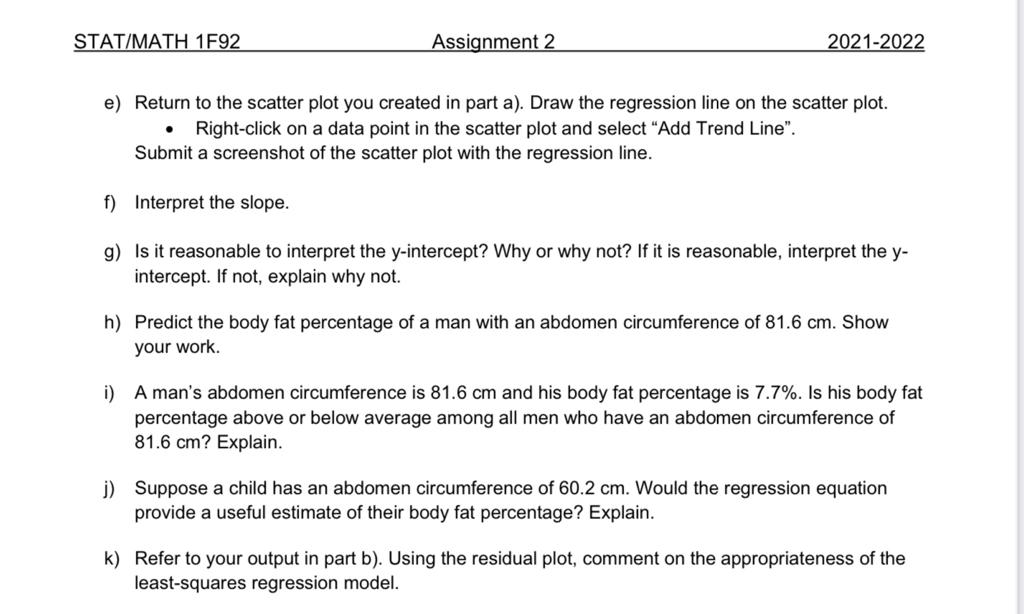
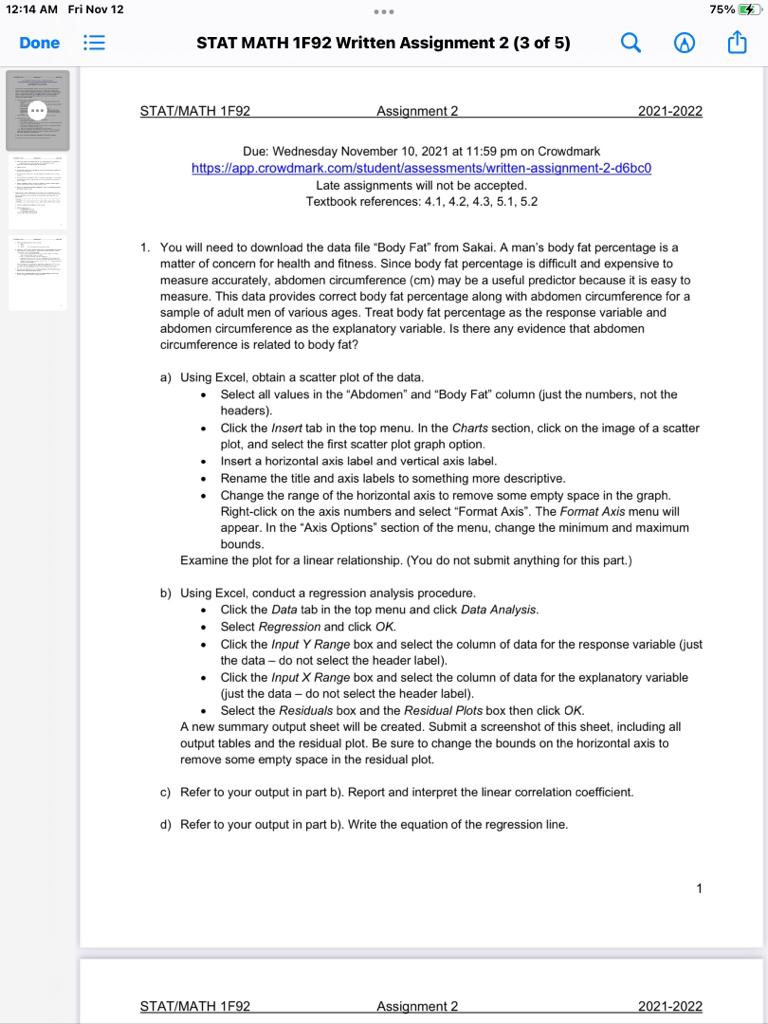
STATIMATH 1 F92 Assignment 2 2021-2022 e) Return to the scatter plot you created in part a). Draw the regression line on the scatter plot. - Right-click on a data point in the scatter plot and select "Add Trend Line". Submit a screenshot of the scatter plot with the regression line. f) Interpret the slope. 9) Is it reasonable to interpret the y-intercept? Why or why not? if it is reasonable. interpret the y- intercept. If not. explain why not. b) Predict the body fat percentage of a man with an abdomen circumference of 81.6 cm. Show your work. i) A man's abdomen circumference is 81.6 cm and his body fat percentage is 7.?%. Is his body fat percentage above or below average among all men who have an abdomen circumference of 81.6 cm? Explain. j) Suppose a child has an abdomen circumference of 60.2 cm. Would the regression equation provide a useful estimate of their body fat percentage? Explain. k) Refer to your output in part b}. Using the residual plot. comment on the appropriateness of the leastsquares regression model. 12:14 AM Fri Nov 12 ... 75% $ Done STAT MATH 1F92 Written Assignment 2 (3 of 5) Q A STAT/MATH 1F92 Assignment 2 2021-2022 Due: Wednesday November 10, 2021 at 11:59 pm on Crowdmark https://app.crowdmark.com/student/assessments/written-assignment-2-d6bc0 Late assignments will not be accepted. Textbook references: 4.1, 4.2, 4.3, 5.1, 5.2 1. You will need to download the data file "Body Fat" from Sakai. A man's body fat percentage is a matter of concern for health and fitness. Since body fat percentage is difficult and expensive to measure accurately, abdomen circumference (cm) may be a useful predictor because it is easy to measure. This data provides correct body fat percentage along with abdomen circumference for a sample of adult men of various ages. Treat body fat percentage as the response variable and abdomen circumference as the explanatory variable. Is there any evidence that abdomen circumference is related to body fat? a) Using Excel, obtain a scatter plot of the data. Select all values in the "Abdomen" and "Body Fat" column (just the numbers, not the headers). Click the Insert tab in the top menu. In the Charts section, click on the image of a scatter plot, and select the first scatter plot graph option. Insert a horizontal axis label and vertical axis label. Rename the title and axis labels to something more descriptive. Change the range of the horizontal axis to remove some empty space in the graph. Right-click on the axis numbers and select "Format Axis". The Format Axis menu will appear. In the "Axis Options" section of the menu, change the minimum and maximum bounds. Examine the plot for a linear relationship. (You do not submit anything for this part.) b) Using Excel, conduct a regression analysis procedure. Click the Data tab in the top menu and click Data Analysis. Select Regression and click OK. . Click the Input Y Range box and select the column of data for the response variable (just the data - do not select the header label). Click the Input X Range box and select the column of data for the explanatory variable (just the data - do not select the header label). . Select the Residuals box and the Residual Plots box then click OK. A new summary output sheet will be created. Submit a screenshot of this sheet, including all output tables and the residual plot. Be sure to change the bounds on the horizontal axis to remove some empty space in the residual plot. c) Refer to your output in part b). Report and interpret the linear correlation coefficient. d) Refer to your output in part b). Write the equation of the regression line. STAT/MATH 1F92 Assignment 2 2021-2022
Step by Step Solution
There are 3 Steps involved in it

Get step-by-step solutions from verified subject matter experts