

Question: Conduct the hypothesis test and provide the test statistic and the critical value, and state the conclusion. A company claims that its packages of 100
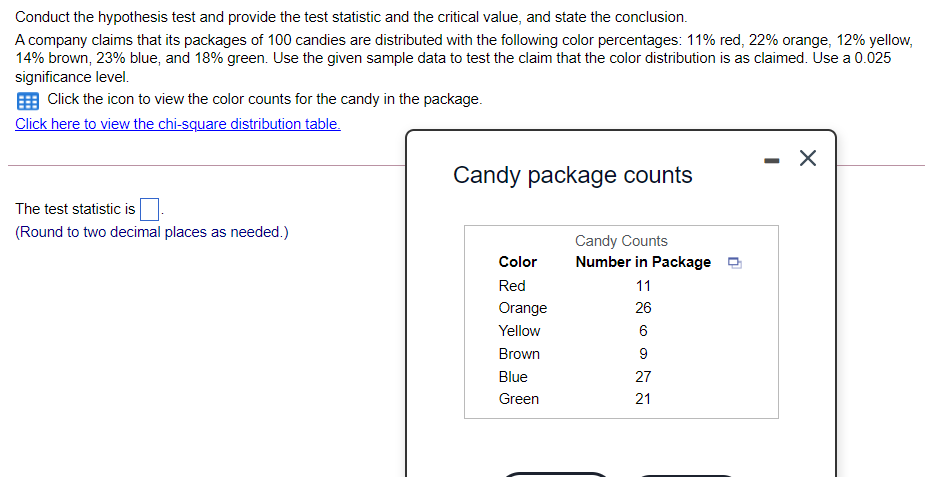

Conduct the hypothesis test and provide the test statistic and the critical value, and state the conclusion. A company claims that its packages of 100 candies are distributed with the following color percentages: 11% red, 2% orange, 12% yellow, 14% brown, 23% blue, and 18% green. Use the given sample data to test the daim that the oolor distribution is as claimed. Use a 0.025 signicance level. g Click the icon to view the color counts for the candy in the package. Click here to View the chisquare distribution table. Candy package counts The test statistic is D. [Round to two decimal places as needed.) Candy Counts lBoiler Number in Package D Red 11 Orange 26 Yellow 5 Brown 9 Blue 2? Green 21
Step by Step Solution
There are 3 Steps involved in it

Get step-by-step solutions from verified subject matter experts