

Question: Consider a binomial experiment with two trials and p =0.1. a. Which of the following tree diagrams accurately represents this binomial experiment? b. Compute the
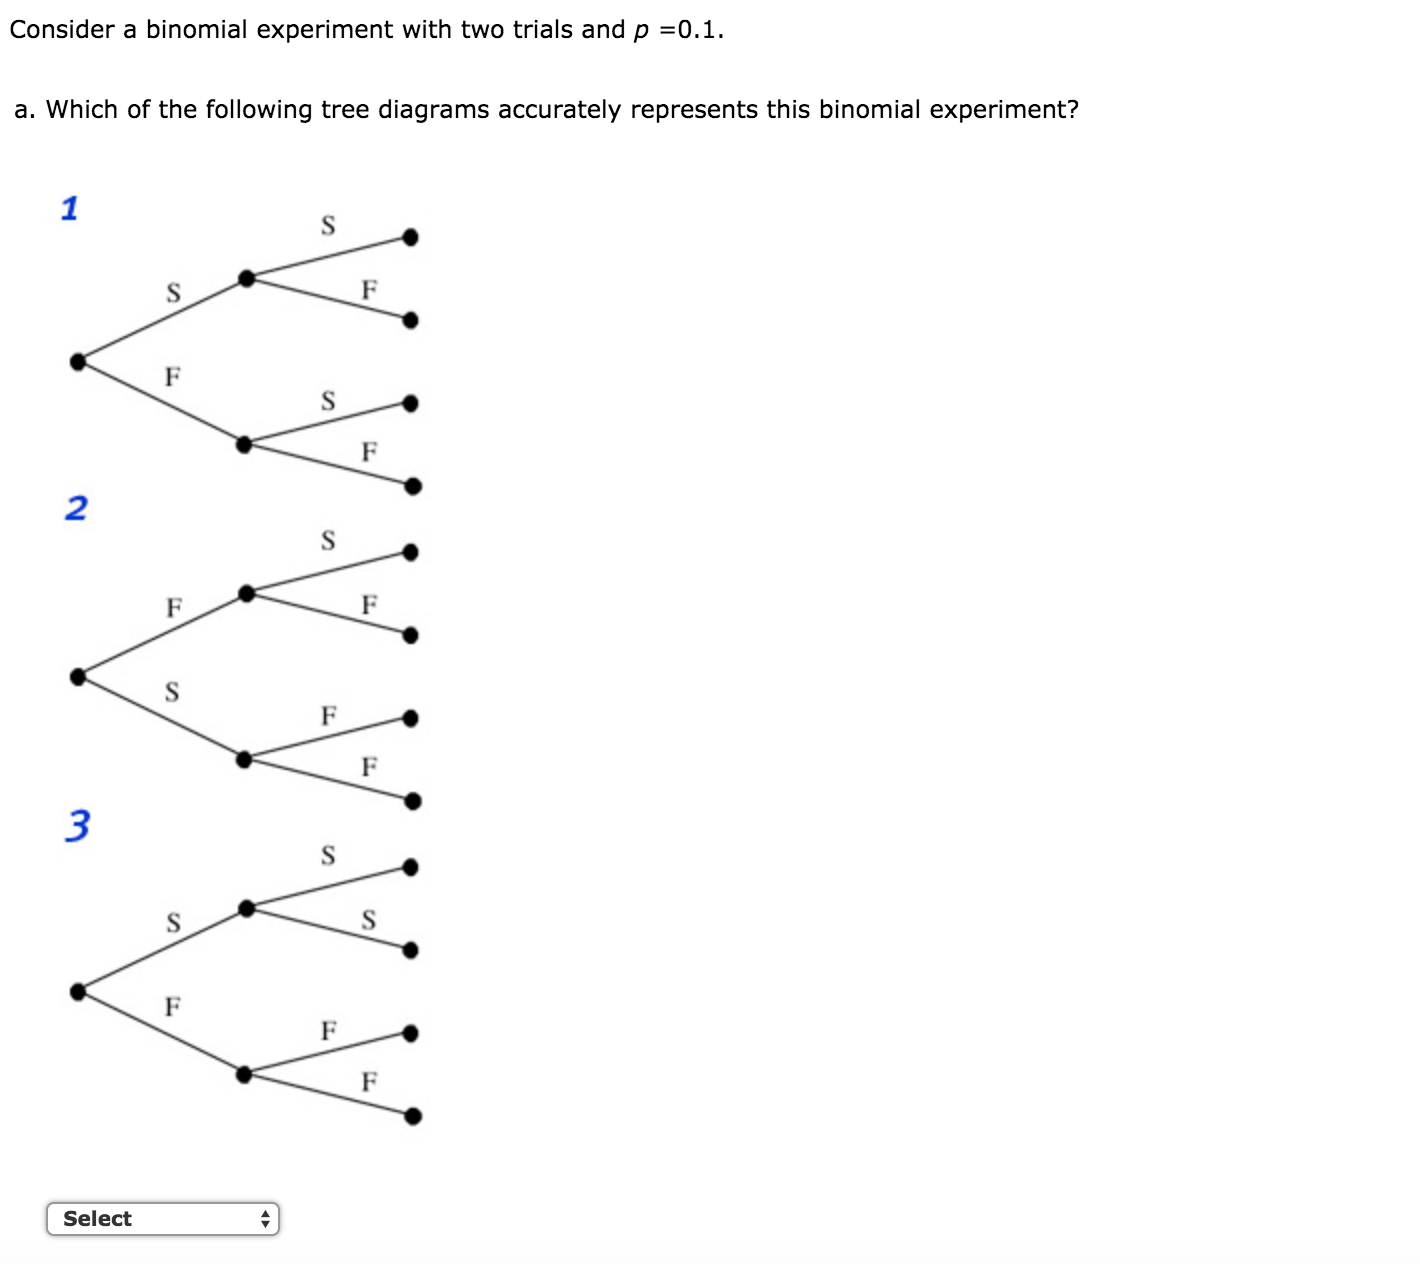
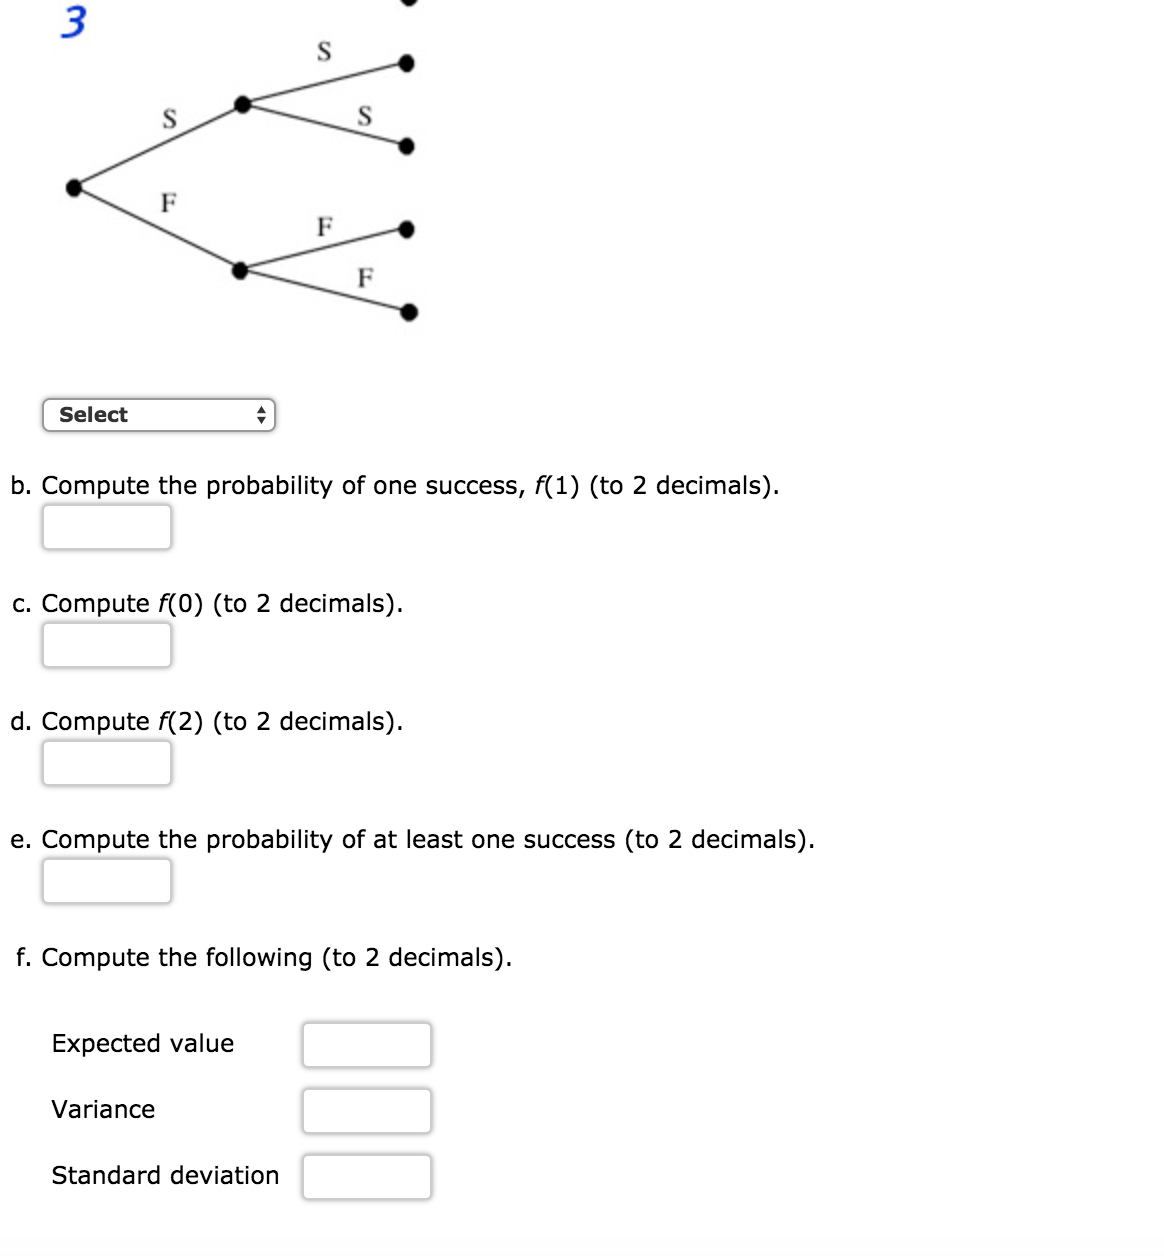
Consider a binomial experiment with two trials and p =0.1. a. Which of the following tree diagrams accurately represents this binomial experiment? b. Compute the probability of one success, f(1) (to 2 decimals). c. Compute f(0) (to 2 decimals). d. Compute f(2) (to 2 decimals). e. Compute the probability of at least one success (to 2 decimals). f. Compute the following (to 2 decimals). Expected value Variance Standard deviation
Step by Step Solution
There are 3 Steps involved in it
1 Expert Approved Answer
Step: 1 Unlock

Question Has Been Solved by an Expert!
Get step-by-step solutions from verified subject matter experts
Step: 2 Unlock
Step: 3 Unlock