

Question: 1. Consider a binomial experiment with two trials and p = 0.7. a. Which of the following tree diagrams accurately represents this binomial experiment? 1.


1.
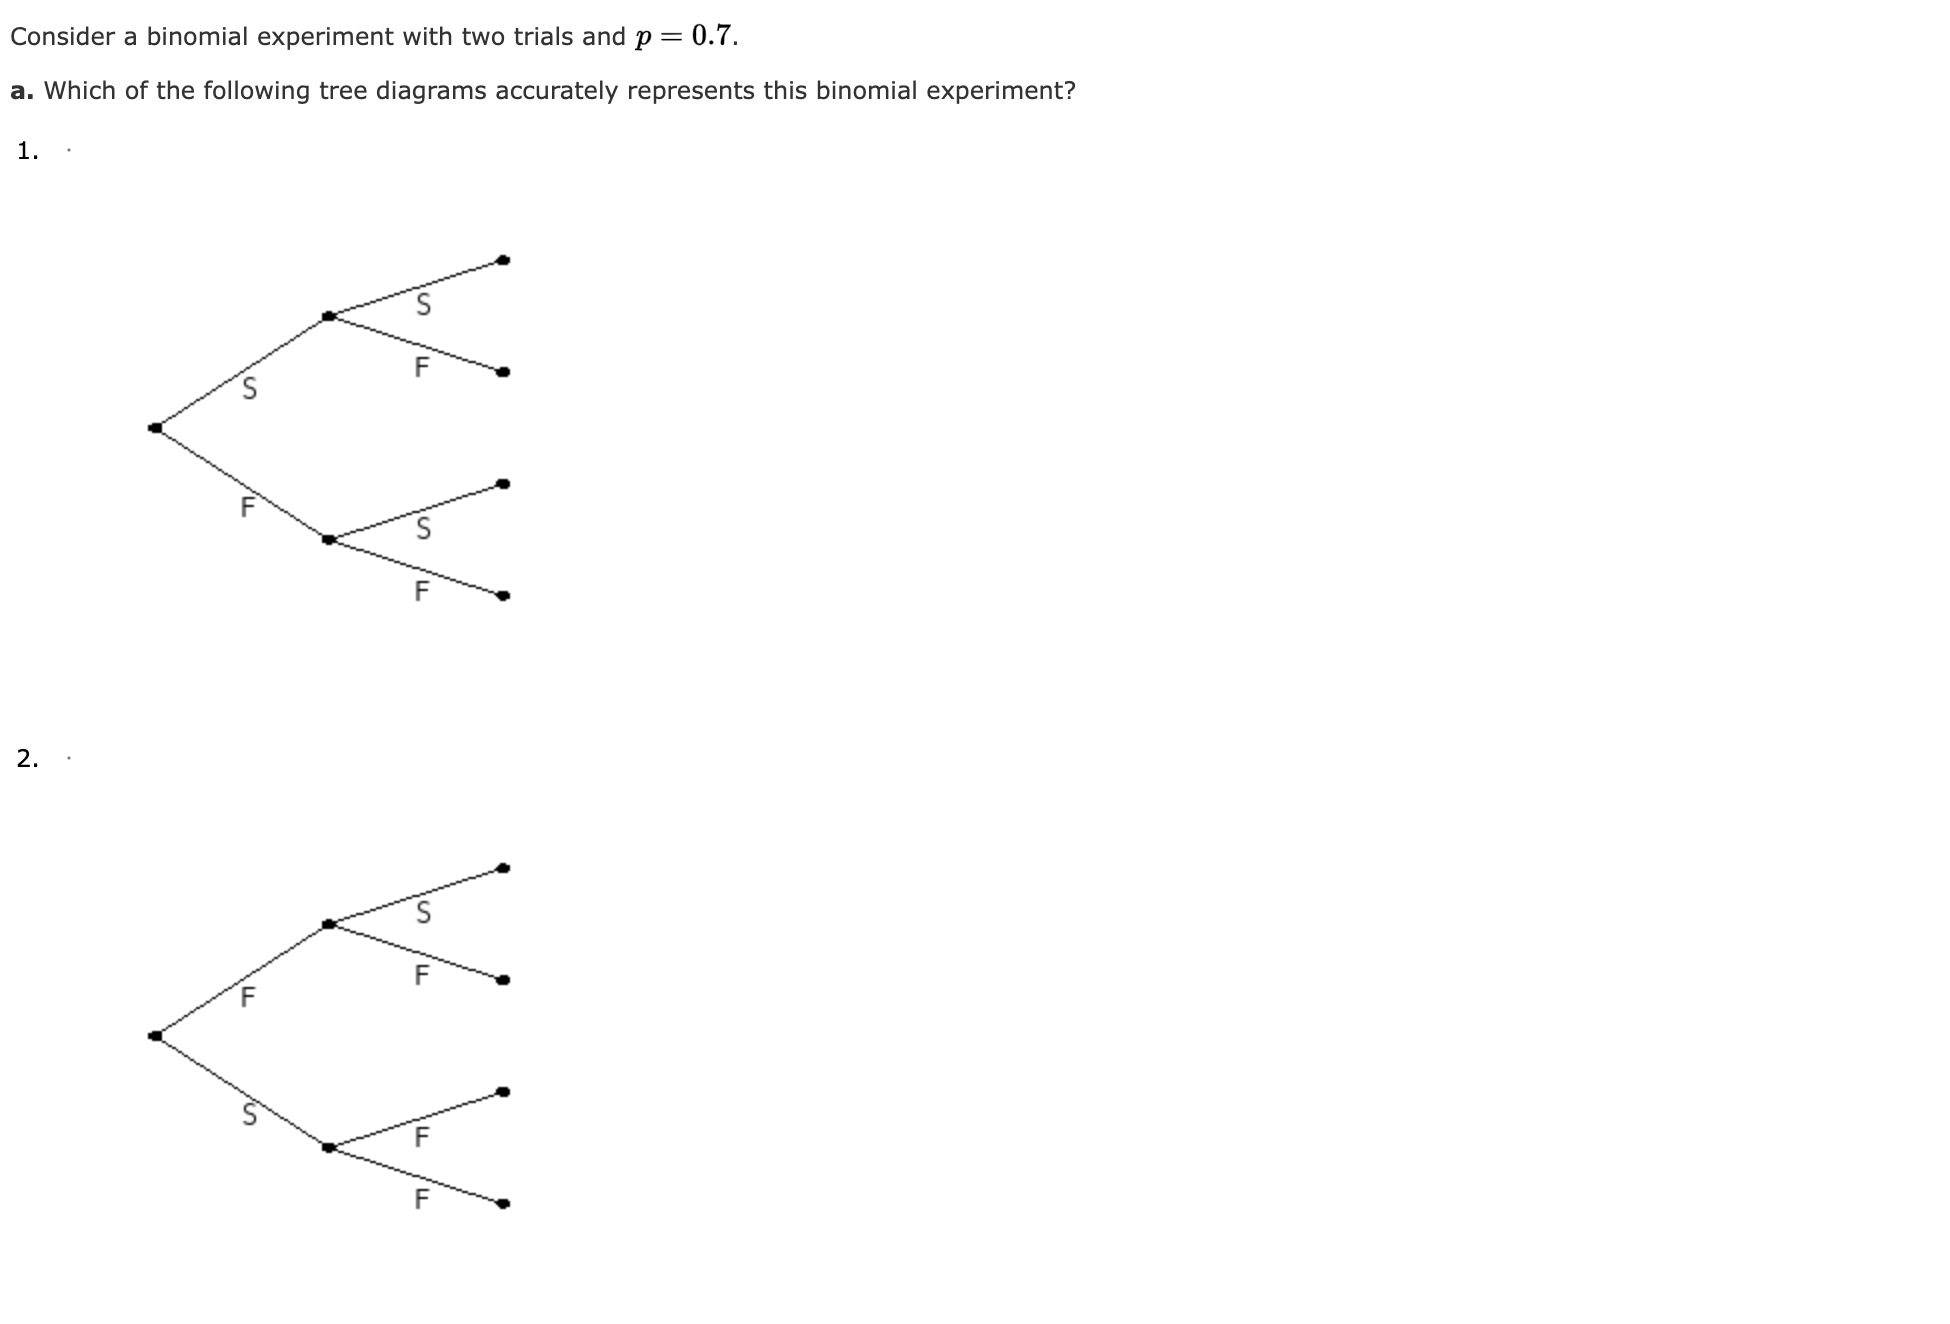
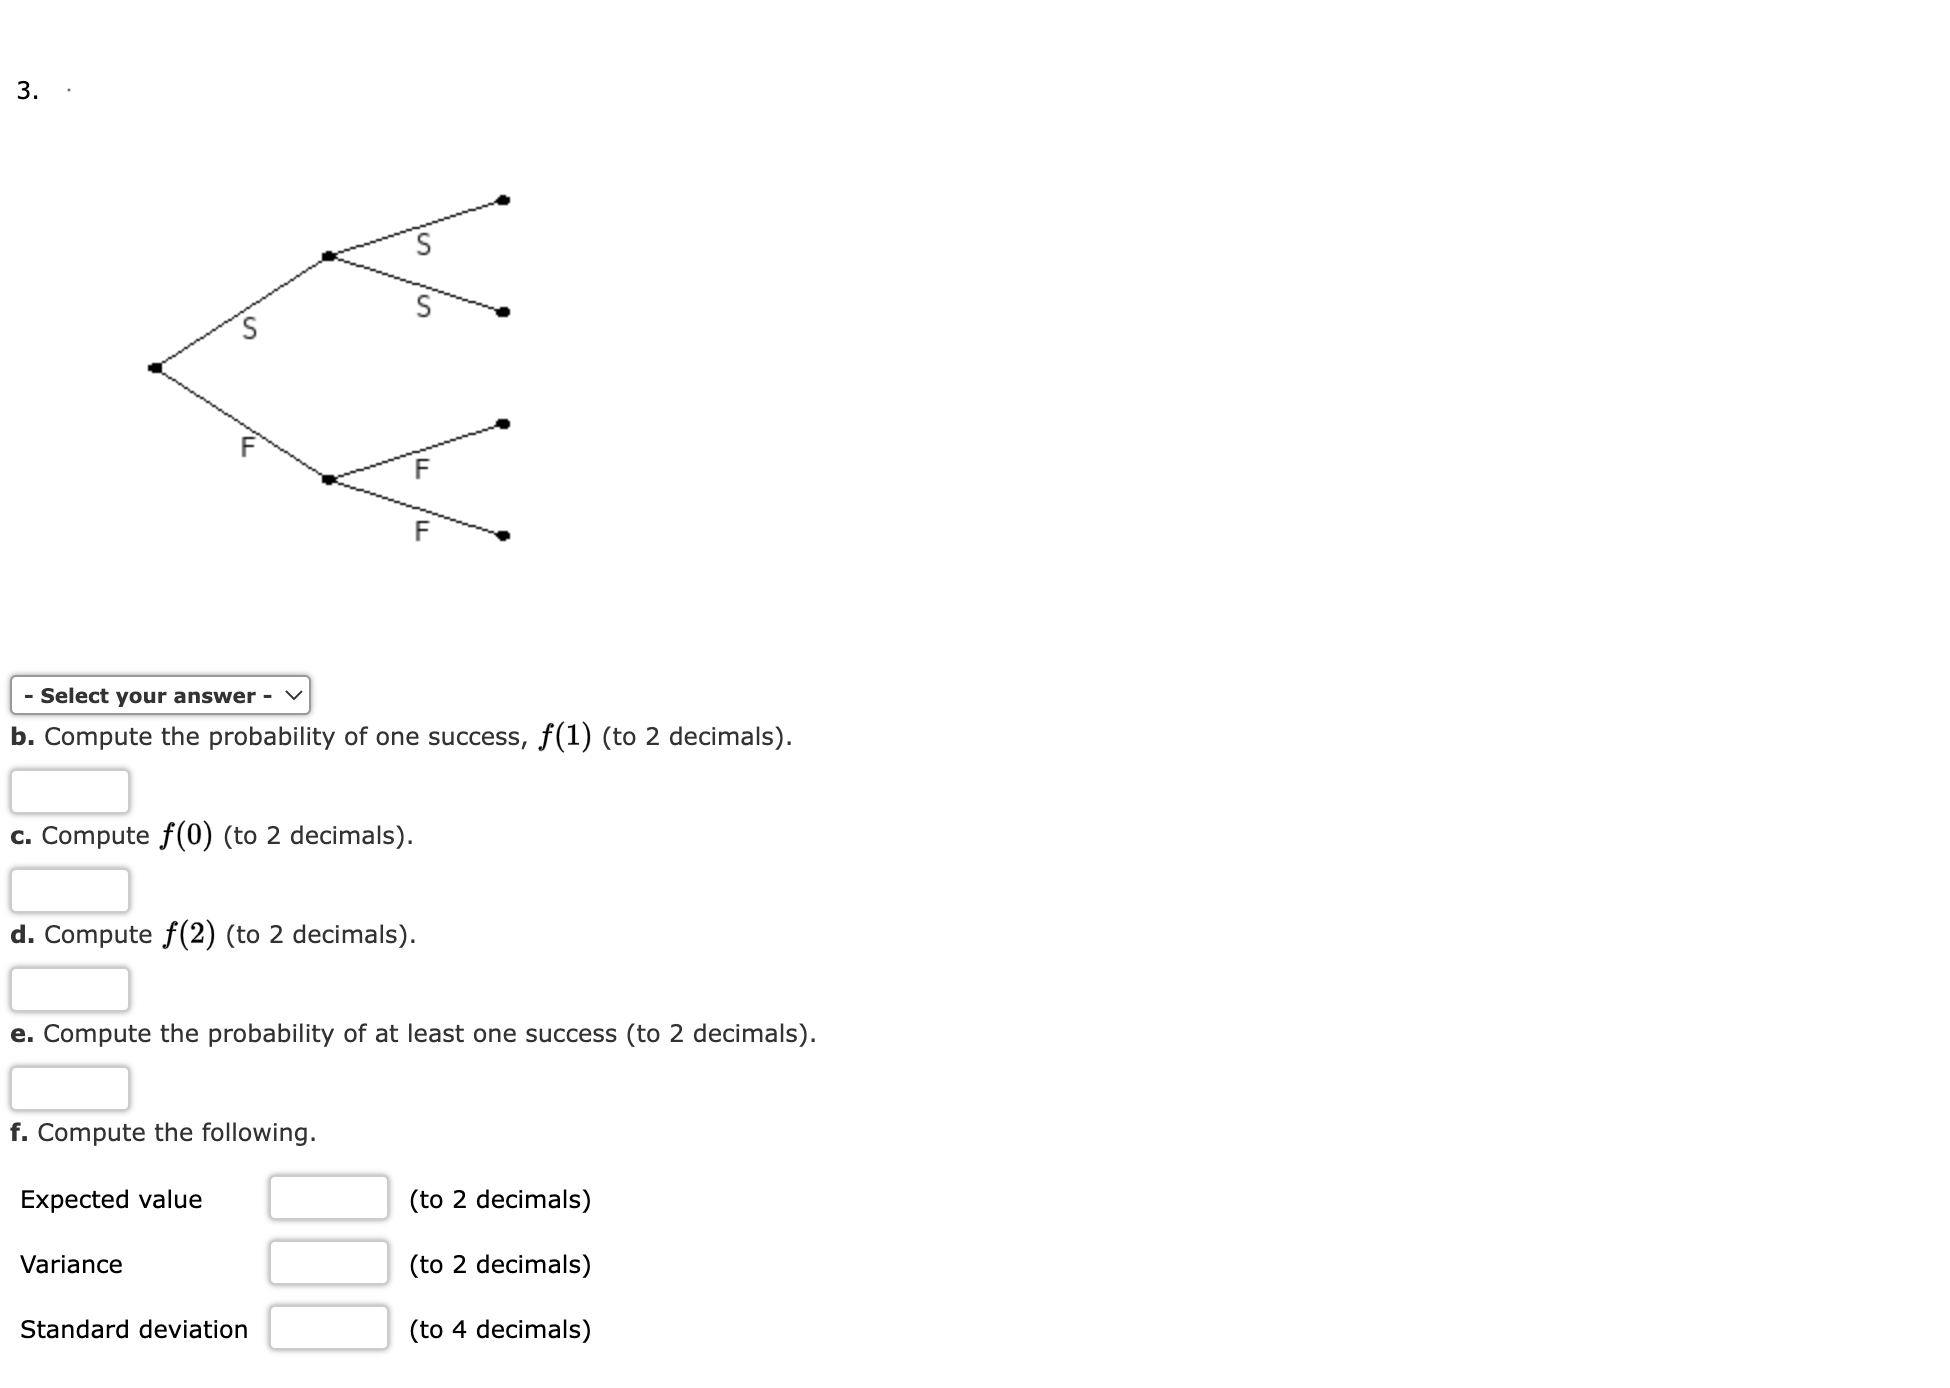
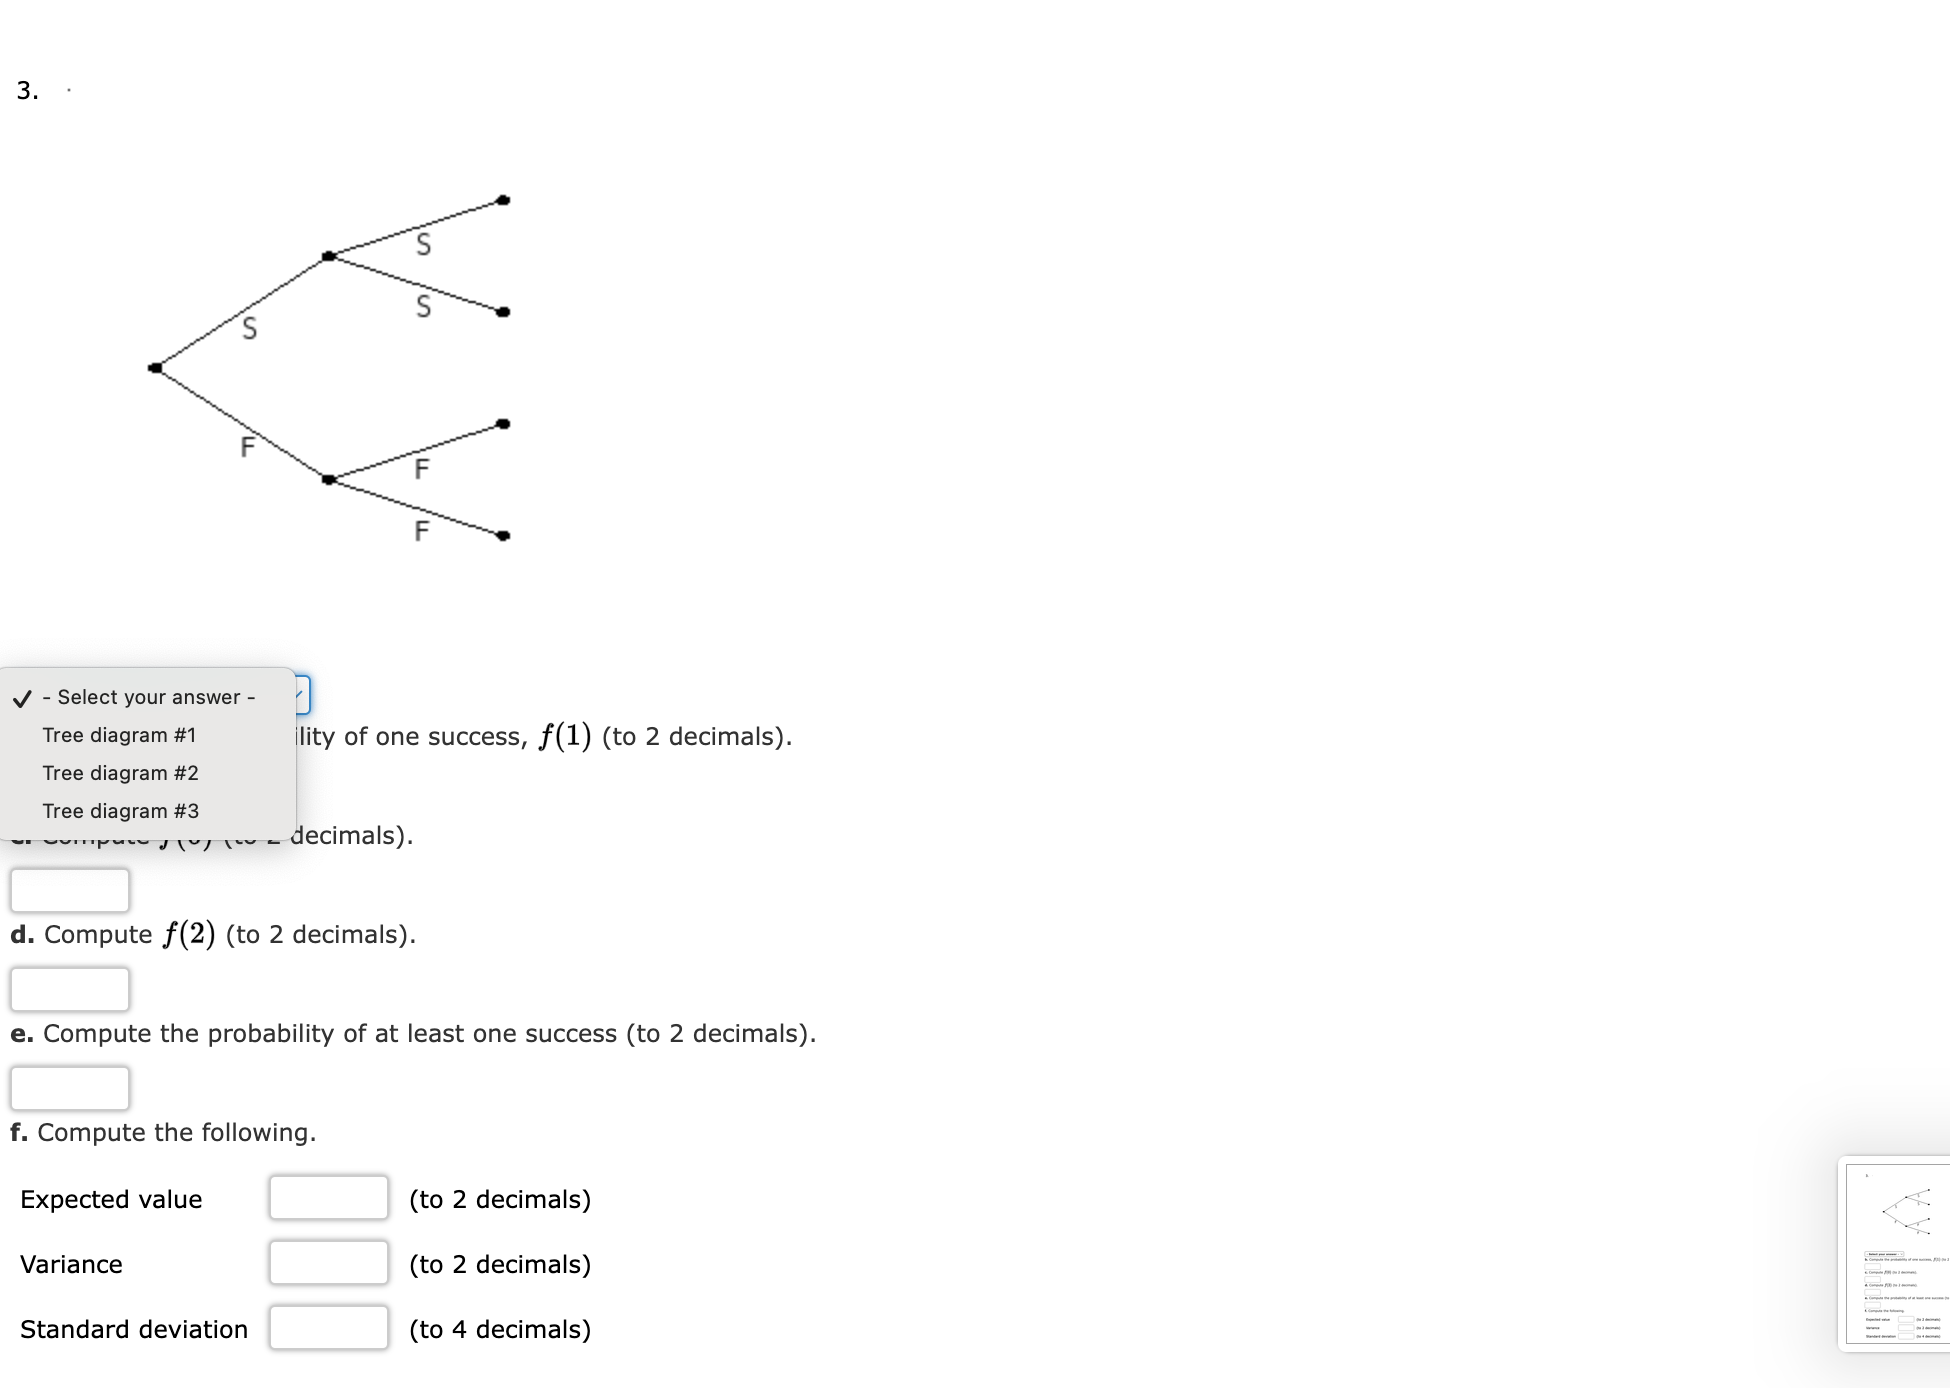


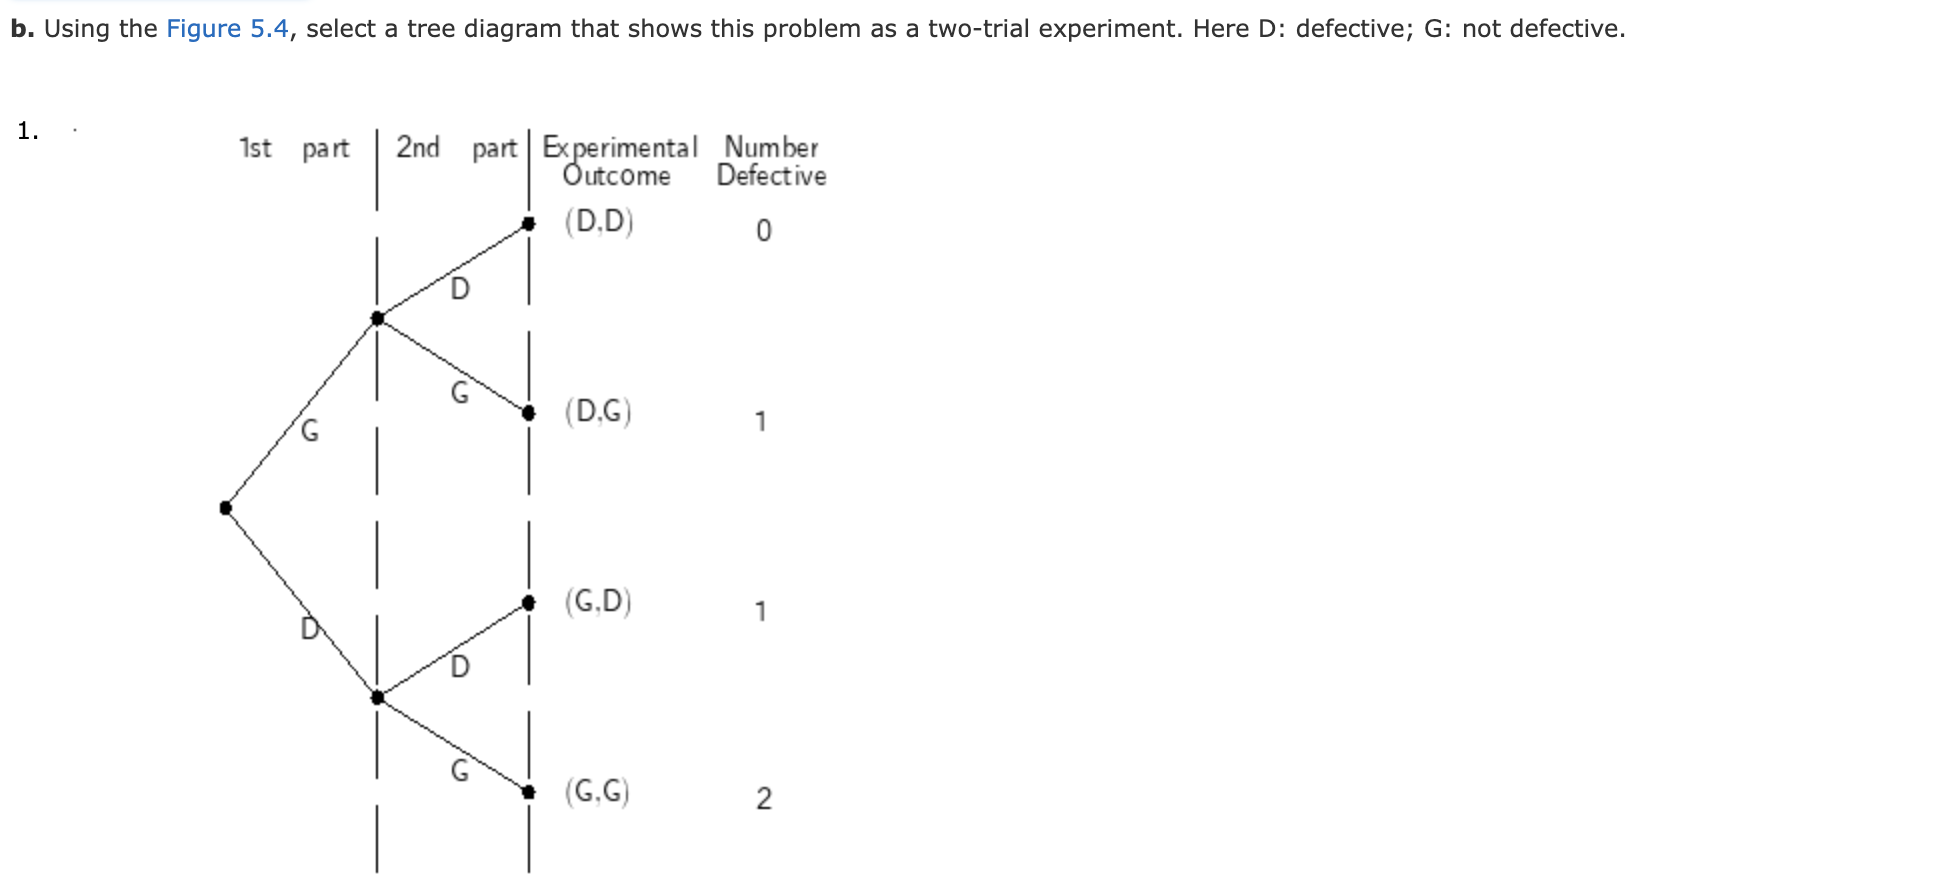
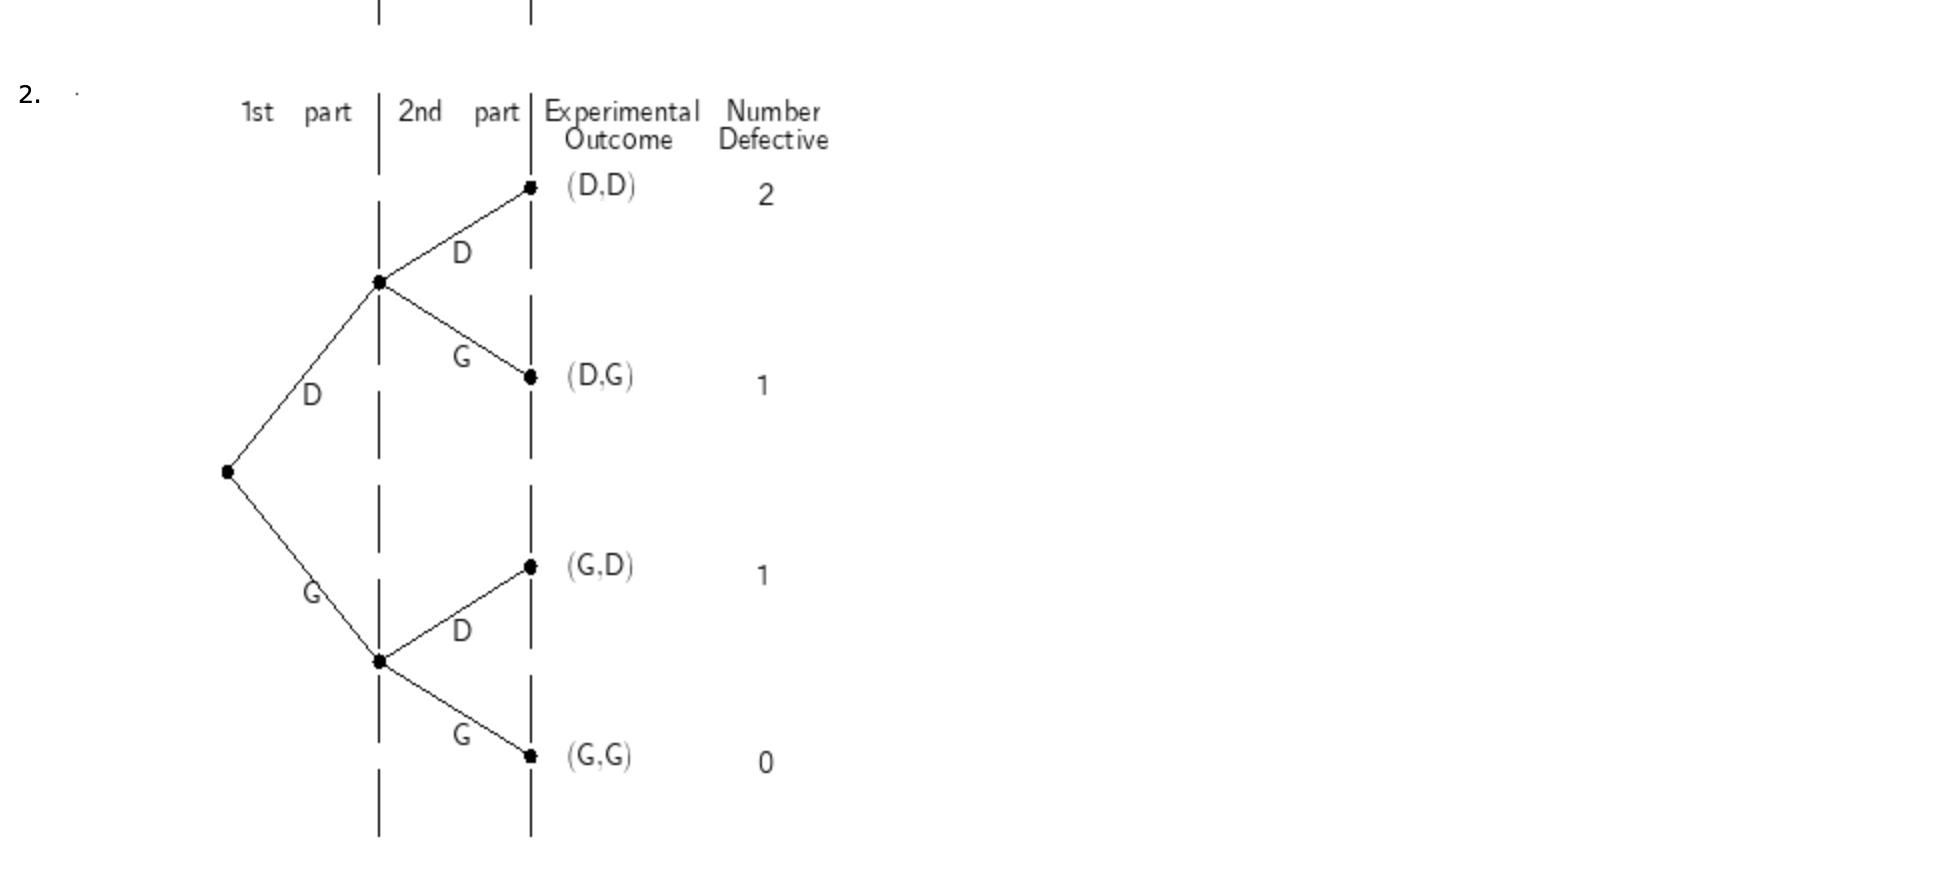
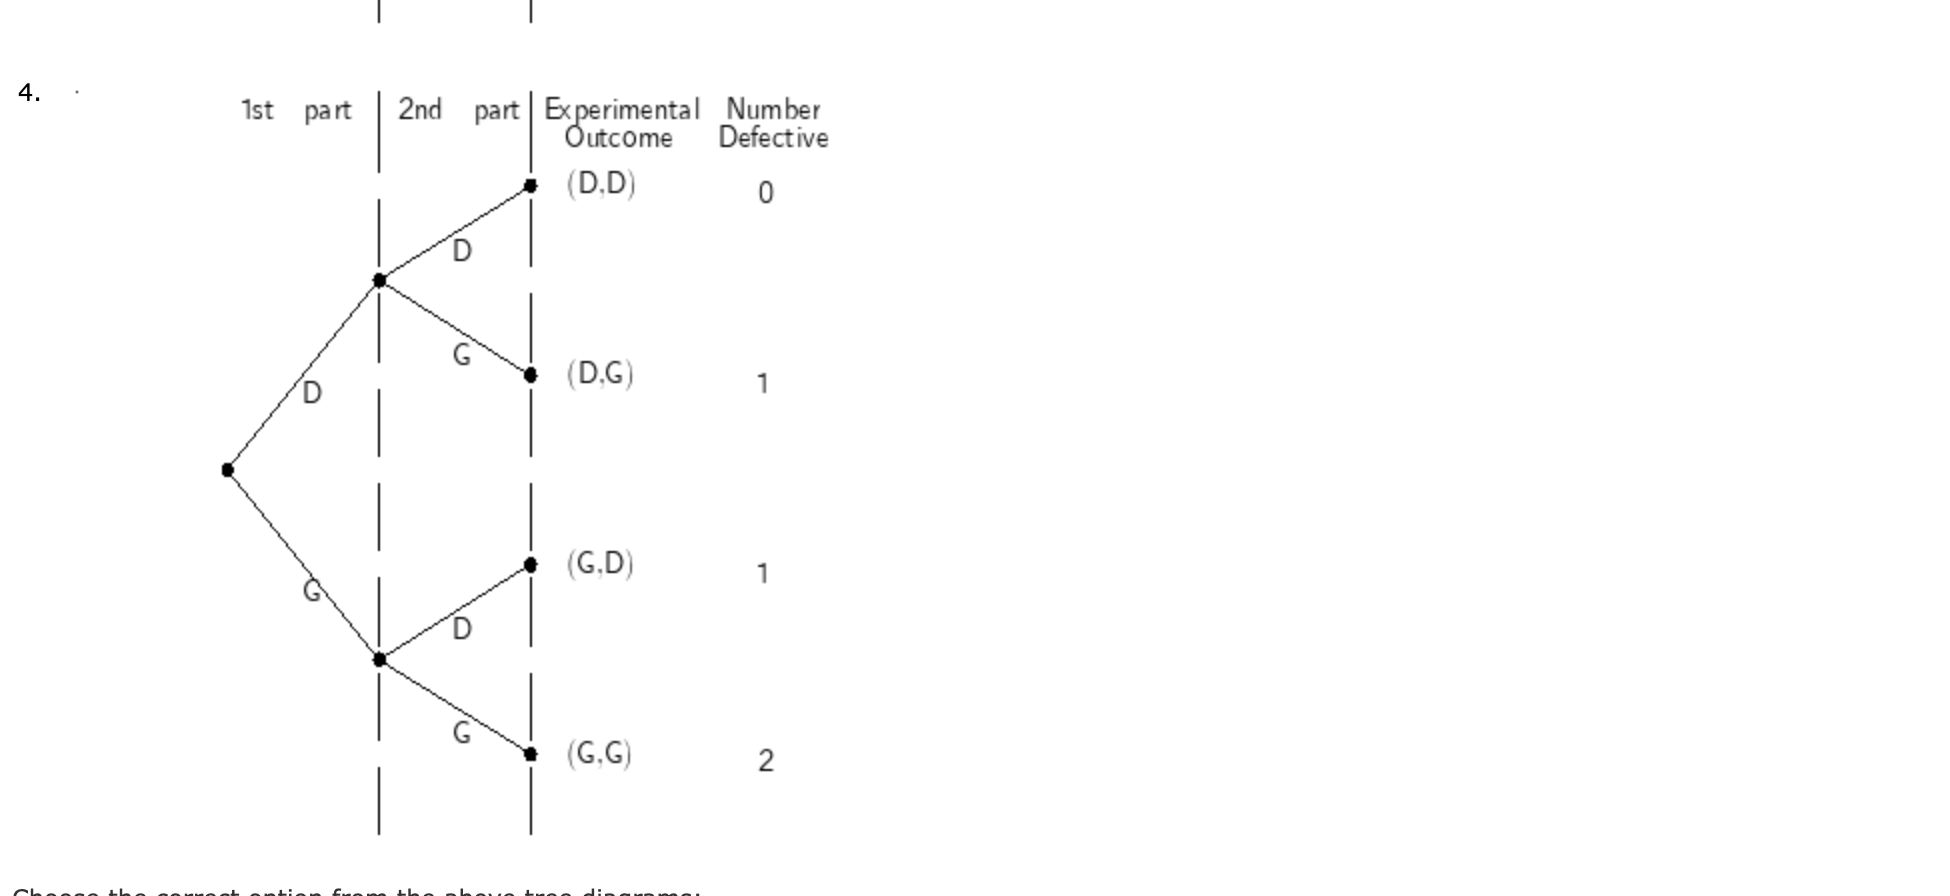
Consider a binomial experiment with two trials and p = 0.7. a. Which of the following tree diagrams accurately represents this binomial experiment? 1. - Select your answer - V b. Compute the probability of one success, f(1) (to 2 decimals). c. Compute f(0) (to 2 decimals). d. Compute f(2) (to 2 decimals). e. Compute the probability of at least one success (to 2 decimals). f. Compute the following. Expected value (to 2 decimals) Variance (to 2 decimals) Standard deviation (to 4 decimals) J Select your answer a Tree diagram #1 ility of one success, f(1) (to 2 decimals). Tree diagram #2 Tree diagram #3 .. w...,,...., J \\V, w. L decnmals). d. Compute f(2) (to 2 decimals). e. Compute the probability of at least one success (to 2 decimals). f. Compute the following. Expected value (to 2 decimals) Variance (to 2 decimals) Standard deviation (to 4 decimals) Consider a binomial experiment with n = 20 and p = 0.70. a. Compute f(12) (to 4 decimals). b. Compute f(16) (to 4 decimals). c. Compute P(x 2 16) (to 4 decimals). d. Compute P(x
Step by Step Solution
There are 3 Steps involved in it

Get step-by-step solutions from verified subject matter experts