

Question: Consider a given data set represented as a matrix with 5 0 rows and 8 columns giving the following statistics in the respective columns. Population:
Consider a given data set represented as a matrix with rows and columns giving the following statistics in the respective columns.
Population:
Population estimate as of July
Income:
Per capita income
Illiteracy:
Illiteracy percent of population
Life Exp:
Life expectancy in years
Murder:
Murder and nonnegligent manslaughter rate per populations
HS Grad:
Percent highschool graduates
Frost:
Mean number of days with minimum temperature below freezing in capital or large city
Area:
Land area in square miles
You are requested to perform variety of exploratory analytics on given data.
Question I:
Find out how many states have an income of less than
Question :
Find out which is the state with the highest income.
Qnestion :
Use a scatter plot to compare the different states for Illiteracy vs LifeExe. The output should look like this:
After that, use the state abbreviation text label to make your plot instead of the scatter points. The output should look like this:
Make histograms of the fifth variable "Murder" using different numbers of bars. Make another plot of murders by region using the factor state rerion on the axis.
Question :
You need to use smooth regression to show the relation between Illiteracy vs LifeFse The outpot should look like this:
Question :
a Draw a histogram that illustrates the population distribution among the states:
b Now split this distribution according to the regions:
Question :
You need to use a scatter plot to show the distribution over the regions using different colors. The output should look like this:
Question :
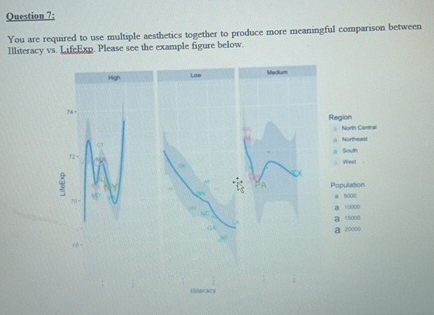
You are required to use multiple aesthetics together to produce more meaningful comparison between Illiteracy vs LifeExp. Please see the example figure below.
Region
Norm Ce cram
Mortienal
Lowt
Weat
Population
a
al
a
a
Step by Step Solution
There are 3 Steps involved in it
1 Expert Approved Answer
Step: 1 Unlock

Question Has Been Solved by an Expert!
Get step-by-step solutions from verified subject matter experts
Step: 2 Unlock
Step: 3 Unlock