

Question: Consider a given data set represented as a matrix with 5 0 rows and 8 columns giving the following statistics in the respective columns. Population:
Consider a given data set represented as a matrix with rows and columns giving the following statistics in the respective columns.
Population:
Population estimate as of July
Question :
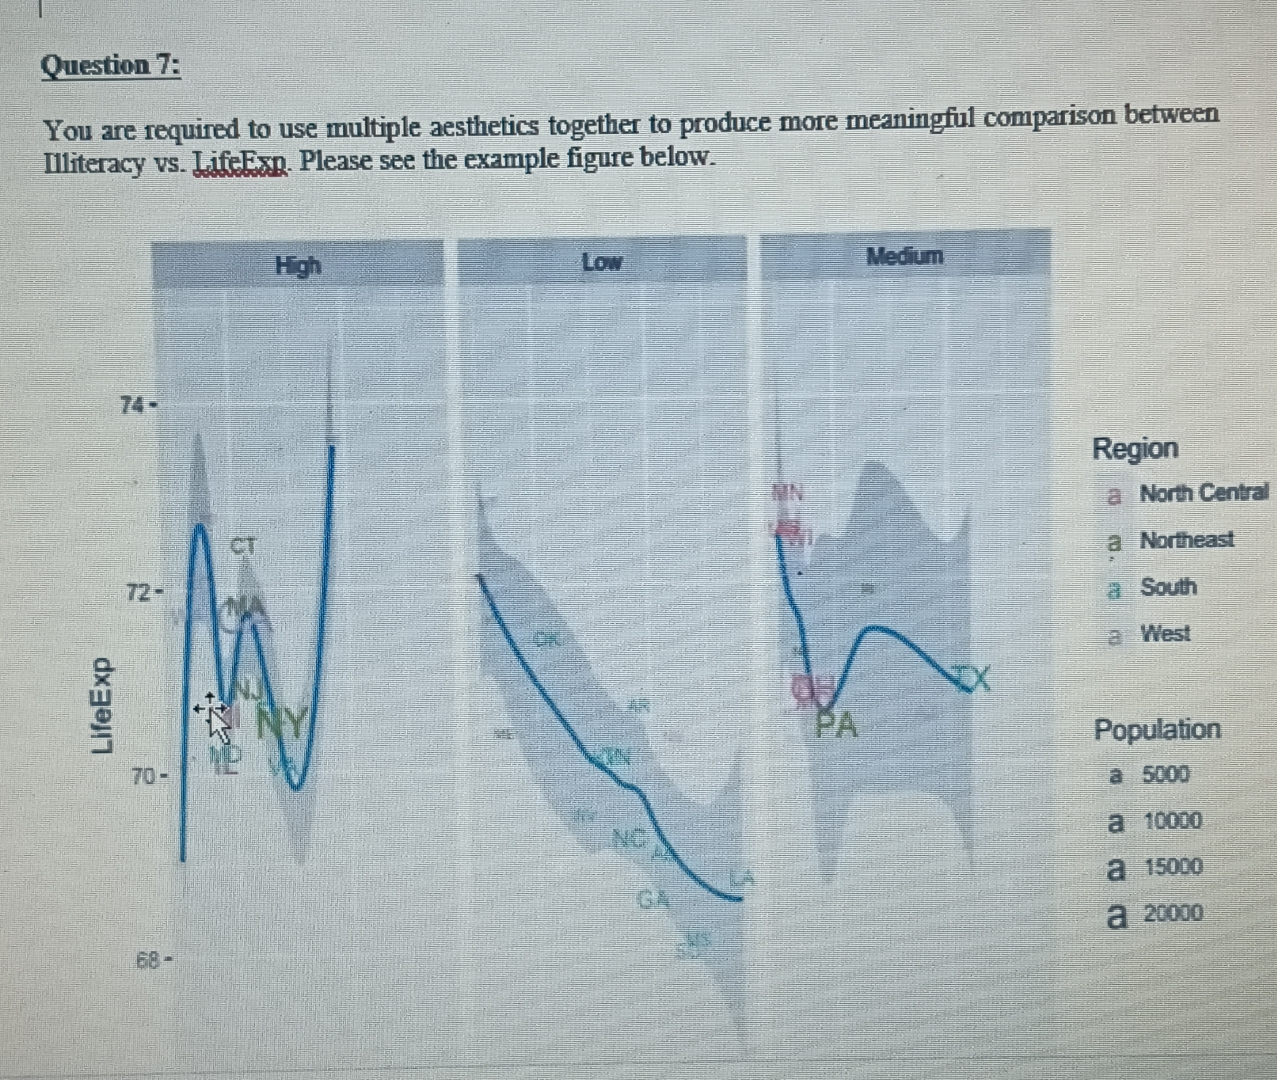
You are required to use multiple aesthetics together to produce more meaningful comparison between Illiteracy vs LifeExs. Please see the example figure below.
Region
a North Central
a Northeast
a South
a West
Population
a
a
a
a
Income:
Per capita income
Illiteracy:
Illiteracy percent of population
Life Exp:
Life expectancy in years
Murder:
Murder and nonnegligent manslaughter rate per populations
HS Grad:
Percent highschool graduates
Frost:
Mean number of days with minimum temperature below freezing in capital or large city
Area:
Land area in square miles
You are requested to perform variety of explor
atory analytics on given data.
i am not able to upload data i have data on csv file i need exact same figure iutput using python
Step by Step Solution
There are 3 Steps involved in it
1 Expert Approved Answer
Step: 1 Unlock

Question Has Been Solved by an Expert!
Get step-by-step solutions from verified subject matter experts
Step: 2 Unlock
Step: 3 Unlock