

Question: Consider a normally distributed population with mean / = 74 and standard deviation o = 10. a. Calculate the centerline, the upper control limit (UCL),
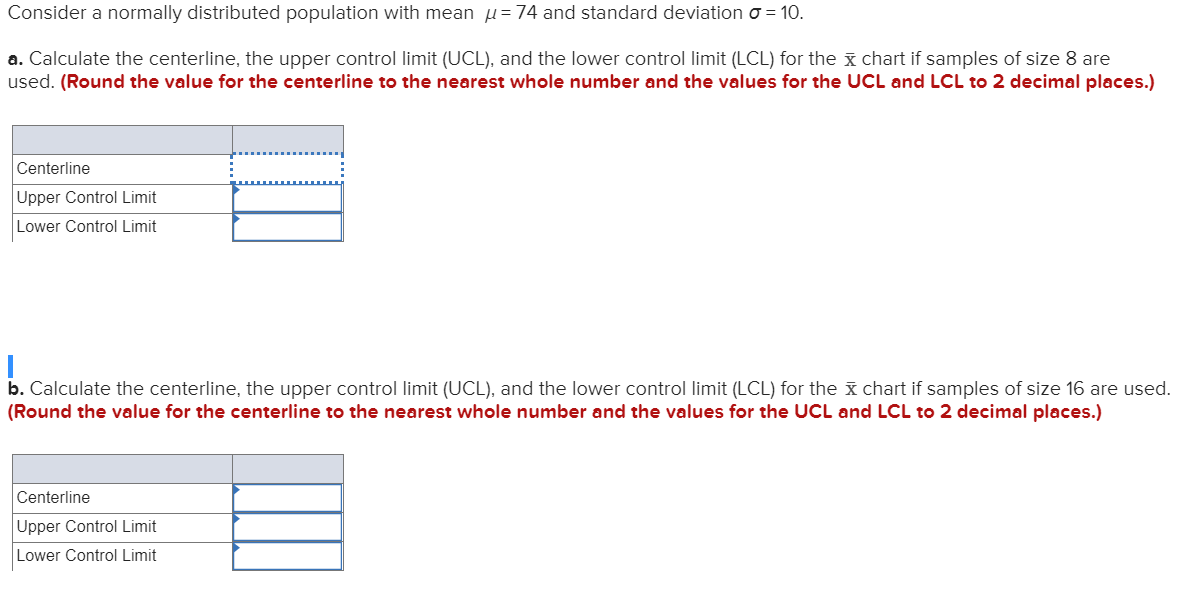
Consider a normally distributed population with mean / = 74 and standard deviation o = 10. a. Calculate the centerline, the upper control limit (UCL), and the lower control limit (LCL) for the x chart if samples of size 8 are used. (Round the value for the centerline to the nearest whole number and the values for the UCL and LCL to 2 decimal places.) Centerline Upper Control Limit Lower Control Limit b. Calculate the centerline, the upper control limit (UCL), and the lower control limit (LCL) for the x chart if samples of size 16 are used. (Round the value for the centerline to the nearest whole number and the values for the UCL and LCL to 2 decimal places.) Centerline Upper Control Limit Lower Control Limit
Step by Step Solution
There are 3 Steps involved in it

Get step-by-step solutions from verified subject matter experts