

Question: Exercise 7 - 3 8 Algo Consider a normally distributed population with mean = 7 0 and standard deviation = 9 . a . Calculate
Exercise Algo
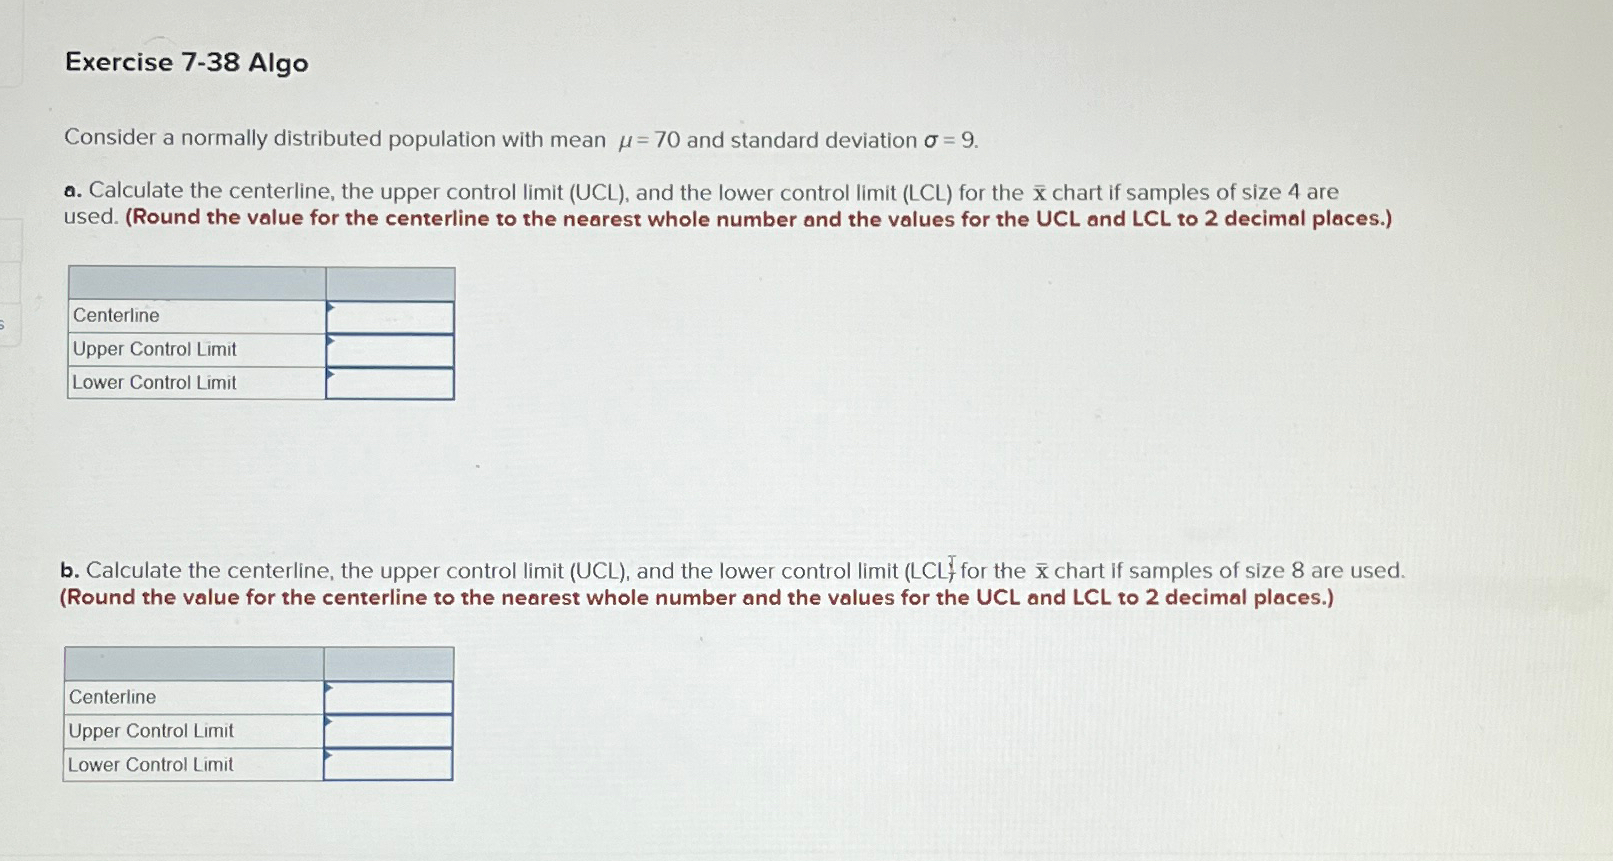
Consider a normally distributed population with mean and standard deviation
a Calculate the centerline, the upper control limit UCL and the lower control limit LCL for the chart if samples of size are used. Round the value for the centerline to the nearest whole number and the values for the UCL and LCL to decimal places.
tableCenterlineUpper Control Limit,Lower Control Limit,
b Calculate the centerline, the upper control limit UCL and the lower control limit LCL for the chart if samples of size are used. Round the value for the centerline to the nearest whole number and the values for the UCL and LCL to decimal places.
tableCenterlineUpper Control Limit,Lower Control Limit,
Step by Step Solution
There are 3 Steps involved in it
1 Expert Approved Answer
Step: 1 Unlock

Question Has Been Solved by an Expert!
Get step-by-step solutions from verified subject matter experts
Step: 2 Unlock
Step: 3 Unlock