

Question: Consider a quantitative-system project with its measurable activity, as presented in Table 1, below. Activity A B C D E F G H Table
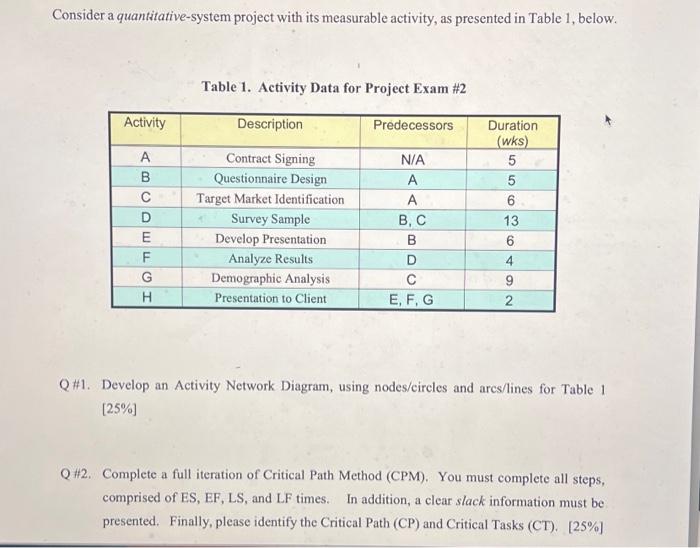
Consider a quantitative-system project with its measurable activity, as presented in Table 1, below. Activity A B C D E F G H Table 1. Activity Data for Project Exam # 2 Description Contract Signing Questionnaire Design Target Market Identification A Survey Sample Develop Presentation Analyze Results Demographic Analysis. Presentation to Client Predecessors N/A A A B, C B D C E, F, G Duration (wks) 5 5 6 13 6 4 9 2 Q#1. Develop an Activity Network Diagram, using nodes/circles and arcs/lines for Table 1 [25%] Q #2. Complete a full iteration of Critical Path Method (CPM). You must complete all steps, comprised of ES, EF, LS, and LF times. In addition, a clear slack information must be presented. Finally, please identify the Critical Path (CP) and Critical Tasks (CT). [25%]
Step by Step Solution
There are 3 Steps involved in it
Answer Lets tackle each question step by step Q1 Develop an Activity Network Diagram To create the A... View full answer

Get step-by-step solutions from verified subject matter experts