

Question: - Consider a service facility with a single server, e.g., a one-operator barbershop, one teller at a bank, or an information desk at an
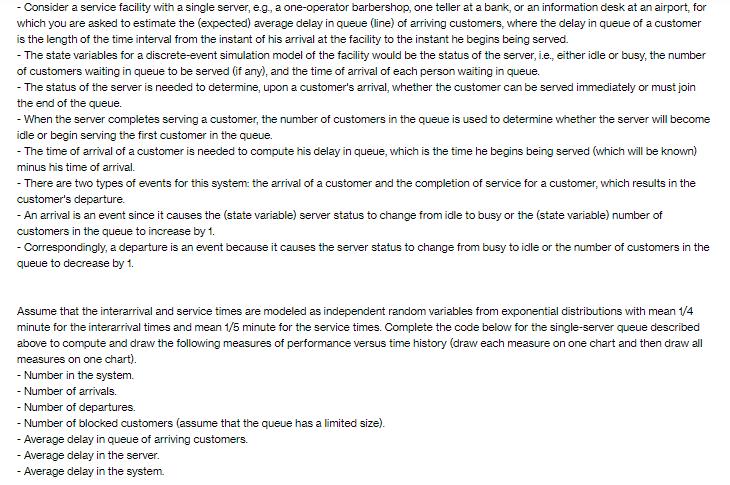
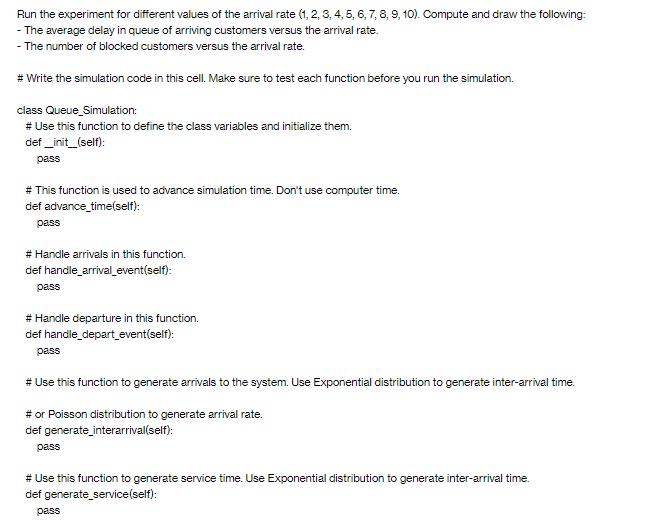
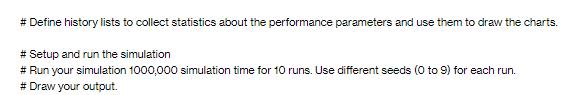
- Consider a service facility with a single server, e.g., a one-operator barbershop, one teller at a bank, or an information desk at an airport, for which you are asked to estimate the (expected) average delay in queue (line) of arriving customers, where the delay in queue of a customer is the length of the time interval from the instant of his arrival at the facility to the instant he begins being served. - The state variables for a discrete-event simulation model of the facility would be the status of the server, i.e., either idle or busy, the number of customers waiting in queue to be served (if any), and the time of arrival of each person waiting in queue. - The status of the server is needed to determine, upon a customer's arrival, whether the customer can be served immediately or must join the end of the queue. - When the server completes serving a customer, the number of customers in the queue is used to determine whether the server will become idle or begin serving the first customer in the queue. - The time of arrival of a customer is needed to compute his delay in queue, which is the time he begins being served (which will be known) minus his time of arrival. - There are two types of events for this system: the arrival of a customer and the completion of service for a customer, which results in the customer's departure. -An arrival is an event since it causes the (state variable) server status to change from idle to busy or the (state variable) number of customers in the queue to increase by 1. - Correspondingly, a departure is an event because it causes the server status to change from busy to idle or the number of customers in the queue to decrease by 1. Assume that the interarrival and service times are modeled as independent random variables from exponential distributions with mean 1/4 minute for the interarrival times and mean 1/5 minute for the service times. Complete the code below for the single-server queue described above to compute and draw the following measures of performance versus time history (draw each measure on one chart and then draw all measures on one chart). - Number in the system. - Number of arrivals. - Number of departures. - Number of blocked customers (assume that the queue has a limited size). - Average delay in queue of arriving customers. - Average delay in the server. - Average delay in the system. Run the experiment for different values of the arrival rate (1, 2, 3, 4, 5, 6, 7, 8, 9, 10). Compute and draw the following: - The average delay in queue of arriving customers versus the arrival rate. - The number of blocked customers versus the arrival rate. # Write the simulation code in this cell. Make sure to test each function before you run the simulation. class Queue_Simulation: # Use this function to define the class variables and initialize them. def_init_(self): pass # This function is used to advance simulation time. Don't use computer time. def advance_time(self): pass # Handle arrivals in this function. handle_arrival_event(self): def pass # Handle departure in this function. def handle_depart_event(self): pass # Use this function to generate arrivals to the system. Use Exponential distribution to generate inter-arrival time. # or Poisson distribution to generate arrival rate. def generate_interarrival(self): pass # Use this function to generate service time. Use Exponential distribution to generate inter-arrival time. def generate_service(self): pass # Define history lists to collect statistics about the performance parameters and use them to draw the charts. # Setup and run the simulation # Run your simulation 1000,000 simulation time for 10 runs. Use different seeds (0 to 9) for each run. # Draw your output.
Step by Step Solution
3.35 Rating (155 Votes )
There are 3 Steps involved in it
It looks like you want to simulate a singleserver queue system and analyze its performance metrics such as average delay in queue number in the system number of arrivals number of departures and more ... View full answer

Get step-by-step solutions from verified subject matter experts