

Question: Consider adding the squared value of the average hours per week spent on math in class (ClassTime_Sq) to the model in Question 1. We obtain
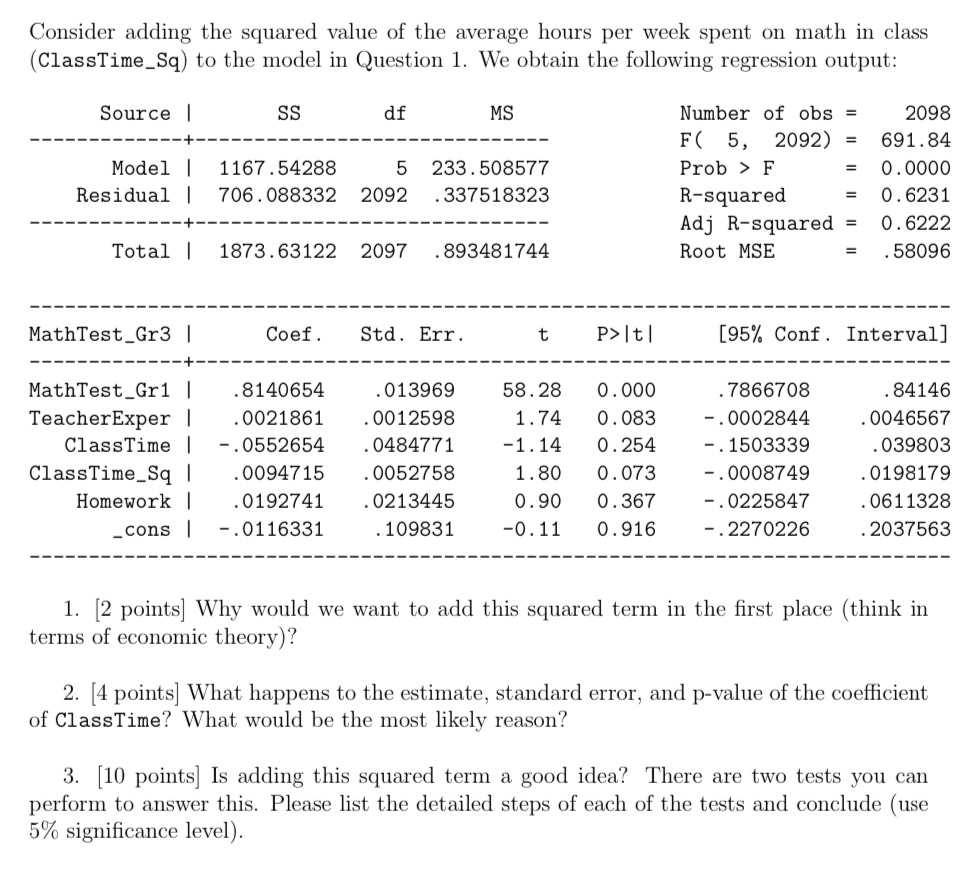
Consider adding the squared value of the average hours per week spent on math in class (ClassTime_Sq) to the model in Question 1. We obtain the following regression output: Source | SS df MS Number of obs = 2098 F( 5, 2092) = 691.84 Model | 1167.54288 5 233.508577 Prob > F 0. 0000 Residual | 706 . 088332 2092 . 337518323 R-squared = 0 . 6231 Adj R-squared = 0.6222 Total | 1873. 63122 2097 . 893481744 Root MSE = . 58096 MathTest_Gr3 | Coef. Std. Err. t P> It/ [95% Conf. Interval] MathTest_Gr1 | . 8140654 . 013969 58. 28 0. 000 . 7866708 . 84146 TeacherExper | . 0021861 . 0012598 1.74 0. 083 - . 0002844 0046567 ClassTime | - . 0552654 . 0484771 -1. 14 0. 254 - . 1503339 . 039803 ClassTime_Sq | . 0094715 . 0052758 1. 80 0. 073 - . 0008749 . 0198179 Homework | 0192741 . 0213445 0. 90 0. 367 - . 0225847 . 0611328 _cons | -. 0116331 . 109831 -0. 11 0. 916 -. 2270226 . 2037563 1. [2 points] Why would we want to add this squared term in the first place (think in terms of economic theory)? 2. [4 points] What happens to the estimate, standard error, and p-value of the coefficient of ClassTime? What would be the most likely reason? 3. [10 points] Is adding this squared term a good idea? There are two tests you can perform to answer this. Please list the detailed steps of each of the tests and conclude (use 5% significance level)
Step by Step Solution
There are 3 Steps involved in it

Get step-by-step solutions from verified subject matter experts