

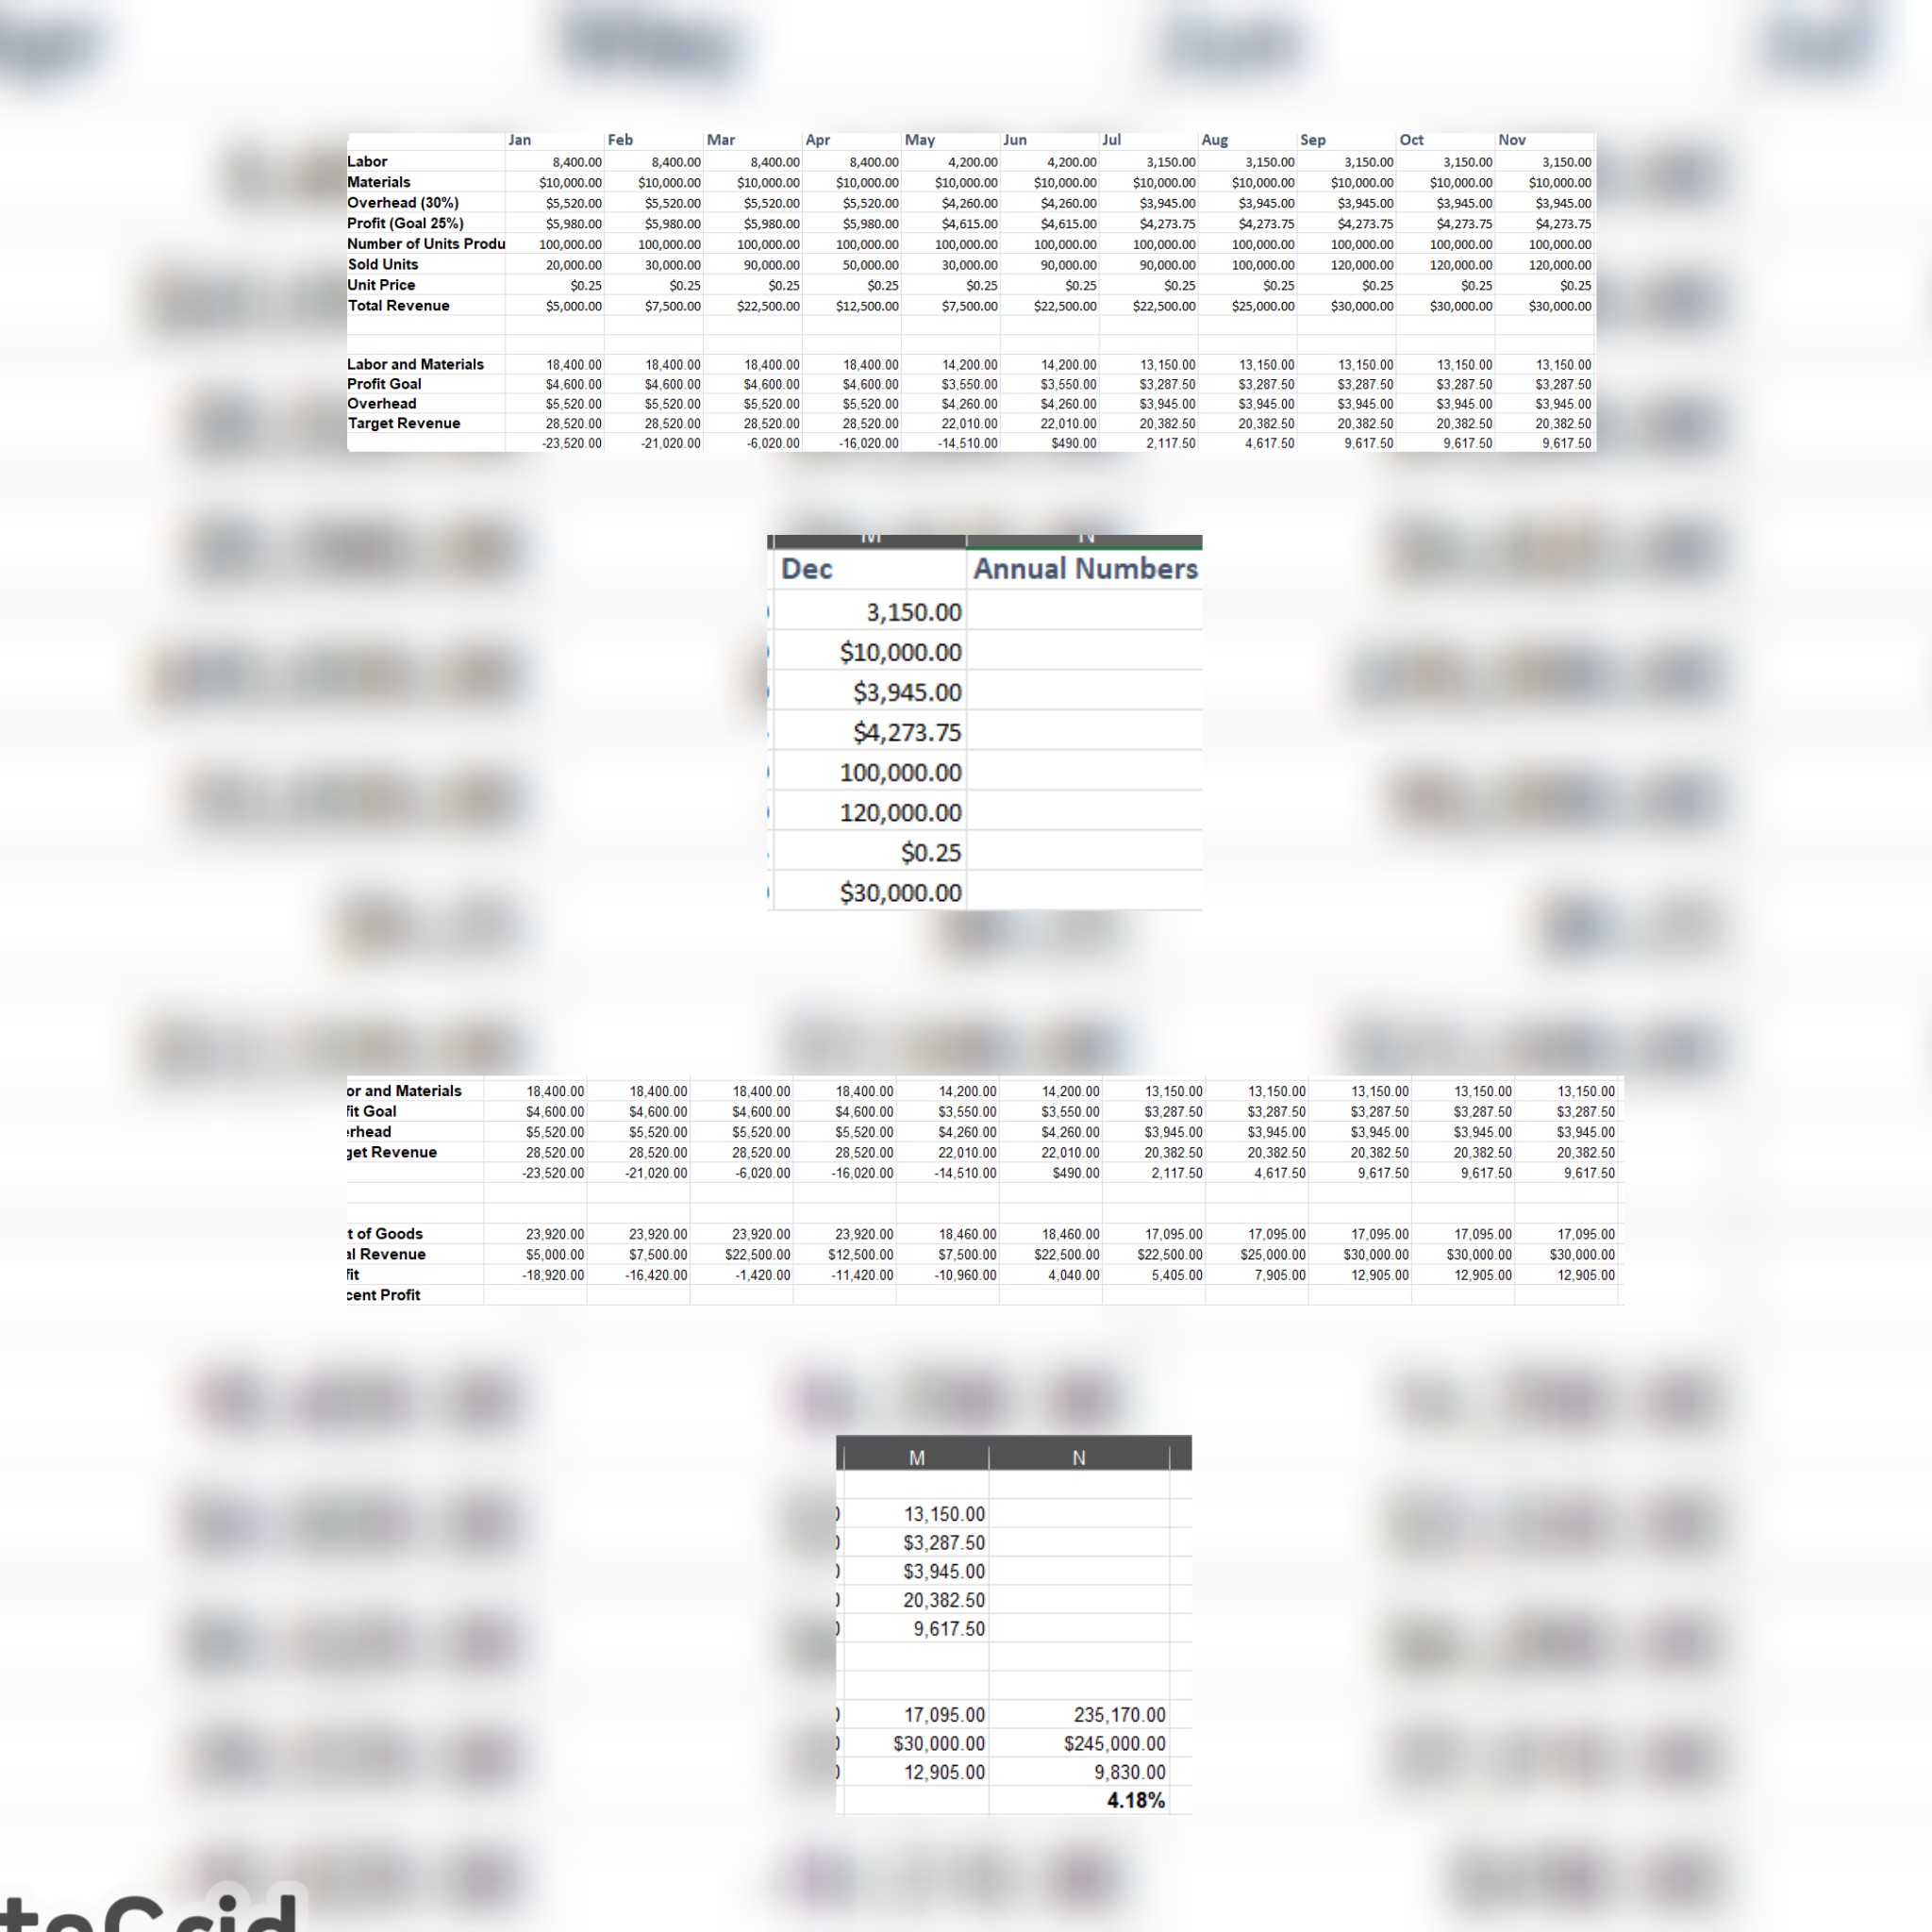
Question: Consider creating data visualizations that illustrate the following information: How have the costs of goods sold ( COGS ) changed over the course of the
Consider creating data visualizations that illustrate the following information: How have the costs of goods sold COGS changed over the course of the year?
How has the profit percentage changed over the course of the PLEASE INCLUDE GRAPHS
Step by Step Solution
There are 3 Steps involved in it
1 Expert Approved Answer
Step: 1 Unlock

Question Has Been Solved by an Expert!
Get step-by-step solutions from verified subject matter experts
Step: 2 Unlock
Step: 3 Unlock