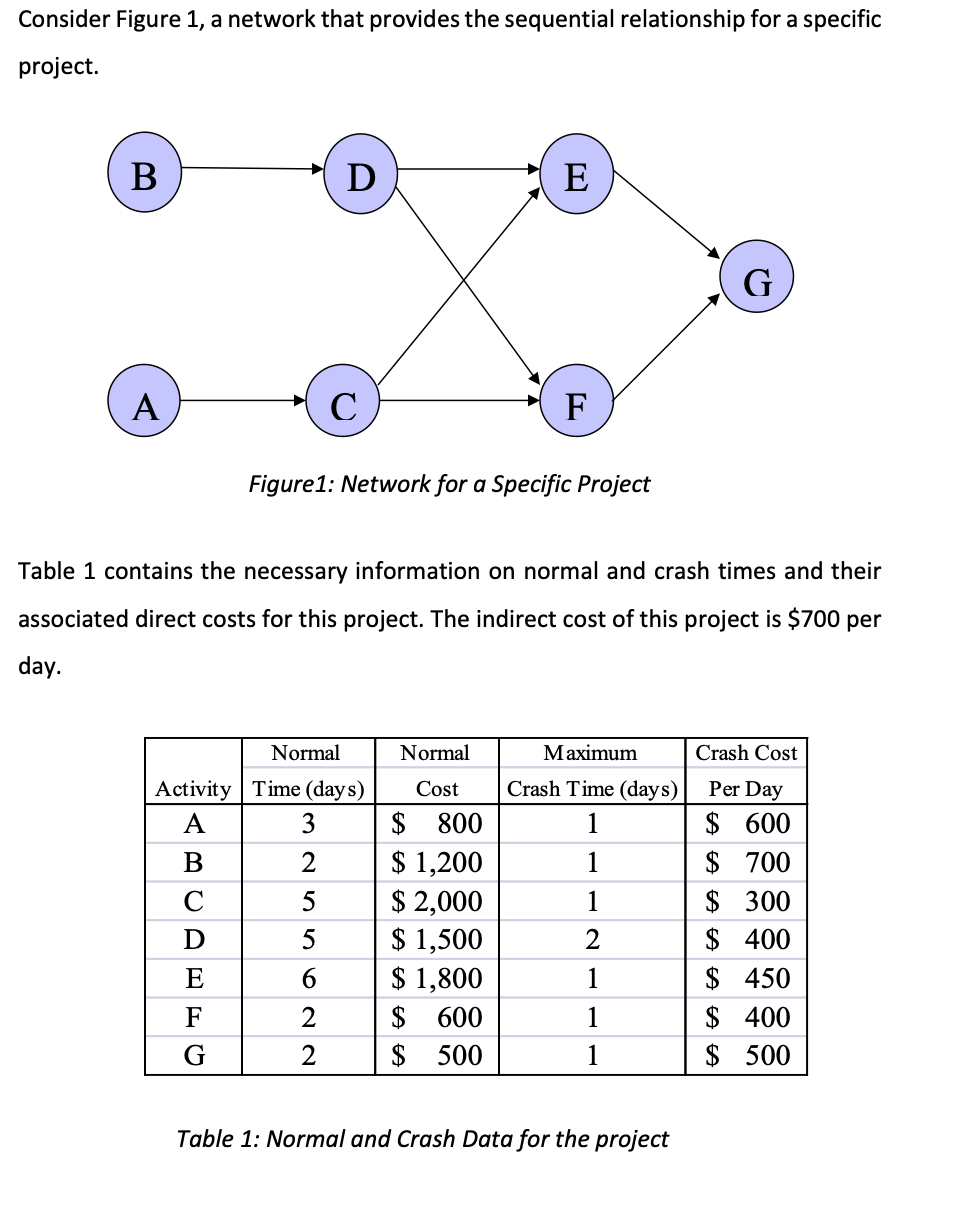
Question: Consider Figure 1, a network that provides the sequential relationship for a specific project. B D E G A F Figure1: Network for a Specific

Consider Figure 1, a network that provides the

Consider Figure 1, a network that provides the

Consider Figure 1, a network that provides the sequential relationship for a specific project. B D E G A F Figure1: Network for a Specific Project Table 1 contains the necessary information on normal and crash times and their associated direct costs for this project. The indirect cost of this project is $700 per day. Normal Normal Maximum Crash Time (days) 1 Activity Time (days) A 3 B 2 5 D 5 1 1 Cost $ 800 $ 1,200 $ 2,000 $ 1,500 $ 1,800 $ 600 $ 500 Crash Cost Per Day $ 600 $ 700 $ 300 $ 400 $ 450 $ 400 $ 500 2 E 6 1 1 F G 2 1 Table 1: Normal and Crash Data for the project Page 3 a) (20 points) Using Critical Path Method find the critical path and project's completion time with normal times? (You will lose 10 points if you find the solution by counting the paths) b) (10 points) What is the total cost of project using the normal times

Step by Step Solution

There are 3 Steps involved in it

1 Expert Approved Answer
Step: 1 Unlock blur-text-image
Question Has Been Solved by an Expert!

Get step-by-step solutions from verified subject matter experts

Step: 2 Unlock
Step: 3 Unlock

Students Have Also Explored These Related General Management Questions!