

Question: Consider historical data showing that the average annual rate of return on the S&P 500 portfolio over the past 85 years has averaged roughly 8%
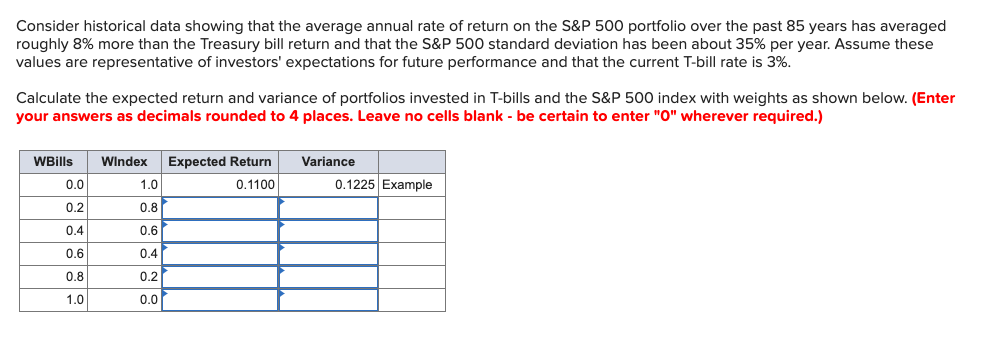
Consider historical data showing that the average annual rate of return on the S&P 500 portfolio over the past 85 years has averaged roughly 8% more than the Treasury bill return and that the S&P 500 standard deviation has been about 35% per year. Assume these values are representative of investors' expectations for future performance and that the current T-bill rate is 3%. Calculate the expected return and variance of portfolios invested in T-bills and the S&P 500 index with weights as shown below. (Enter your answers as decimals rounded to 4 places. Leave no cells blank - be certain to enter "0" wherever required.) WBills 0.0 0.2 Variance 0.1225 Example Windex Expected Return 1.0 0.1100 0.87 0.6 0.41 0.2 0.6 0.8 1.0 0.0
Step by Step Solution
There are 3 Steps involved in it

Get step-by-step solutions from verified subject matter experts