

Question: Consider historical data showing that the average annual return on the S & P 5 0 0 portfolio over the past 8 0 years have
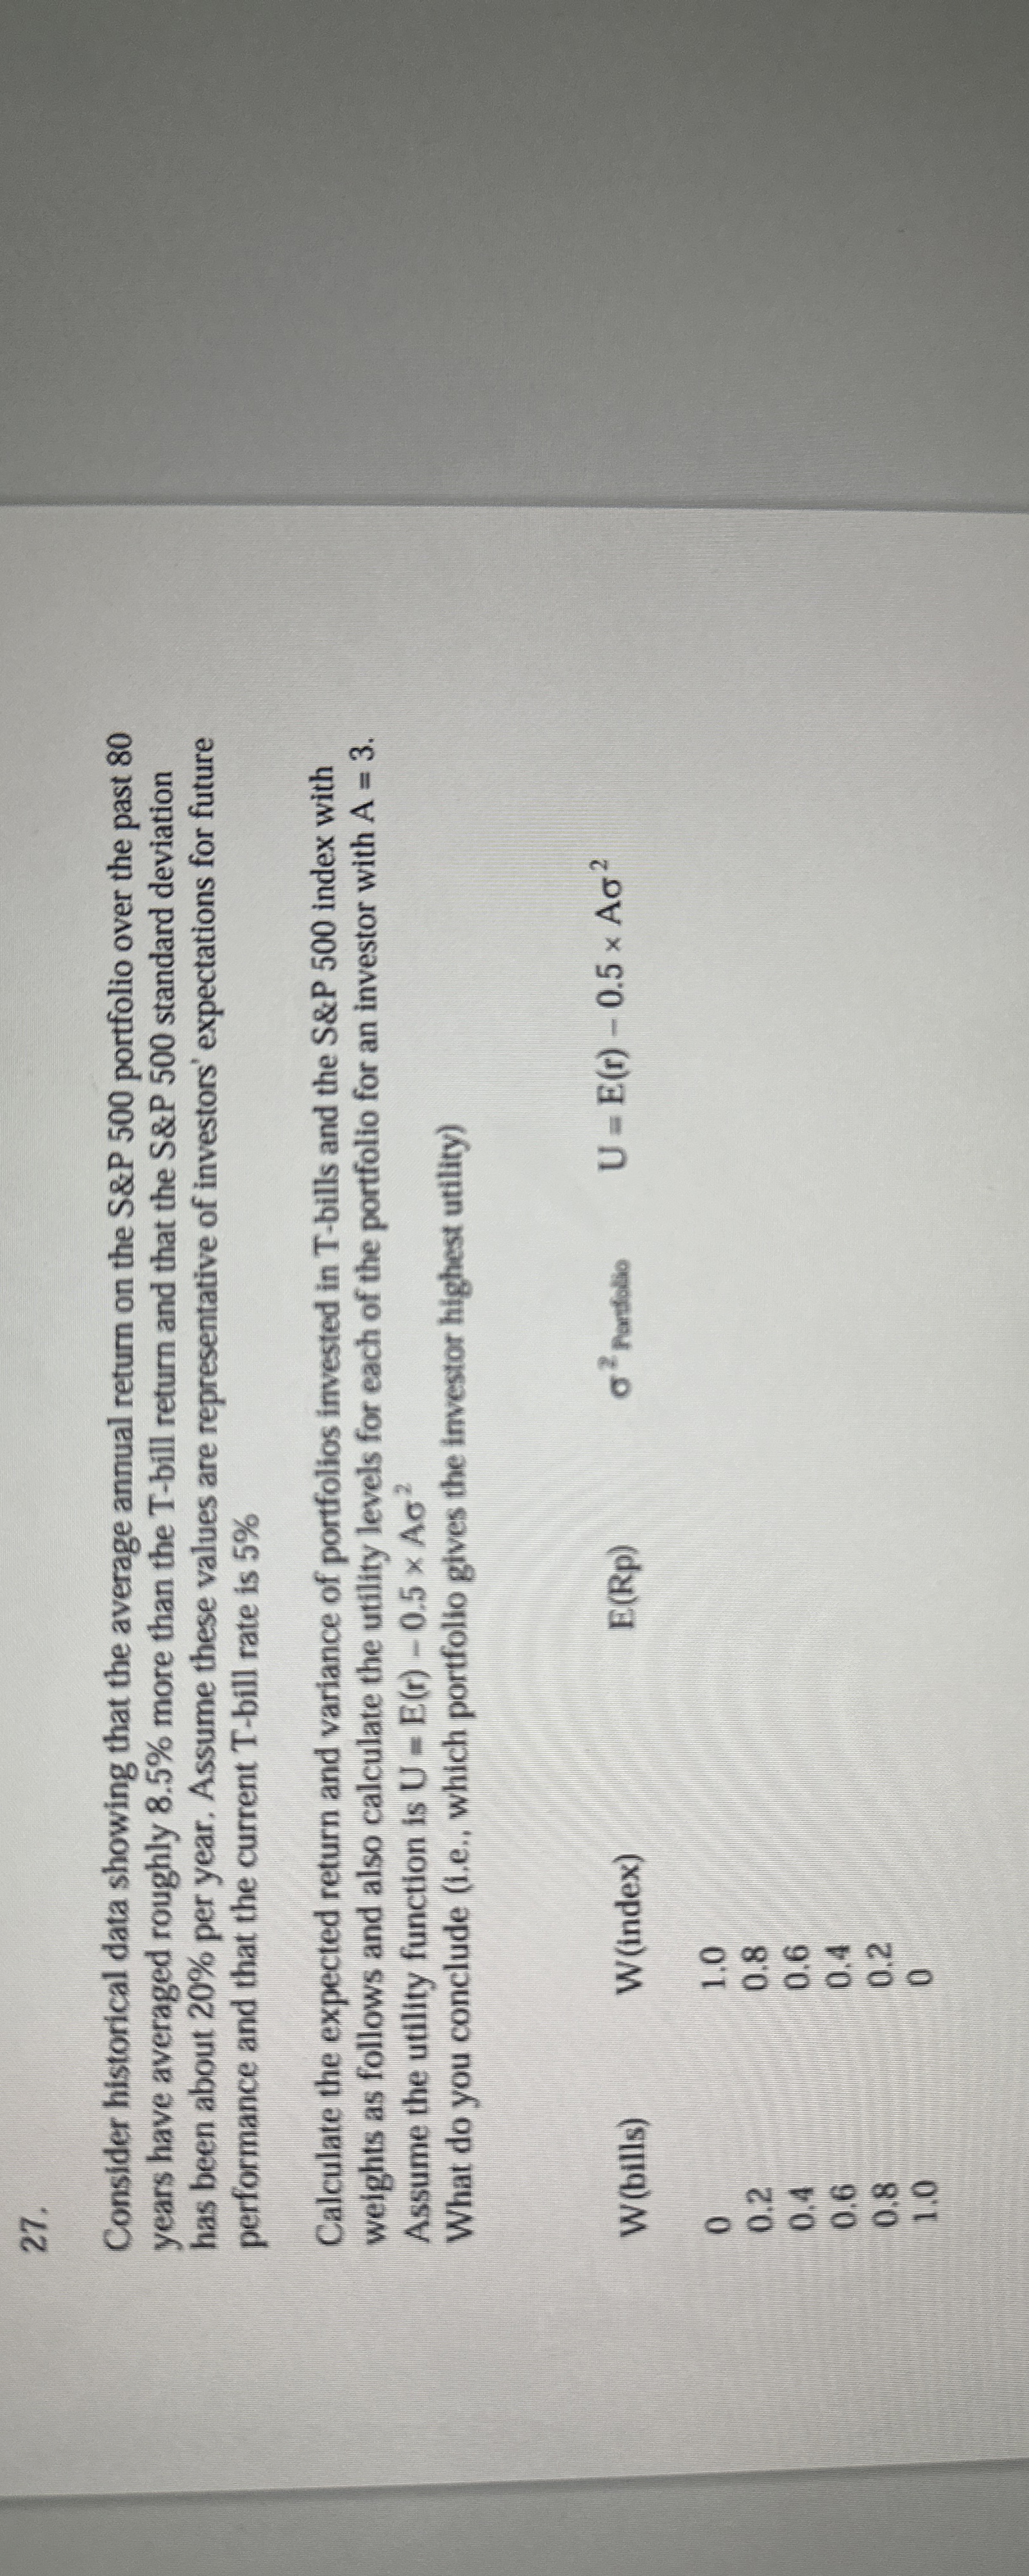
Consider historical data showing that the average annual return on the & portfolio over the past years have averaged roughly more than the T bill return and that the & standard deviation has been about per year. Assume these values are representative of investors' expectations for future performance and that the current Tbill rate is
Calculate the expected return and variance of portfolios invested in Tbills and the S&P index with weights as follows and also calculate the utility levels for each of the portfolio for an investor with Assume the utility function is
What do you conclude ie which portfolio gives the investor highest utility
tableWbillsindex rondolio
Step by Step Solution
There are 3 Steps involved in it
1 Expert Approved Answer
Step: 1 Unlock

Question Has Been Solved by an Expert!
Get step-by-step solutions from verified subject matter experts
Step: 2 Unlock
Step: 3 Unlock