

Question: please show work Consider historical data showing that the average annual return on the S&P 500 portfolio over the past 80 years have averaged roughly
please show work
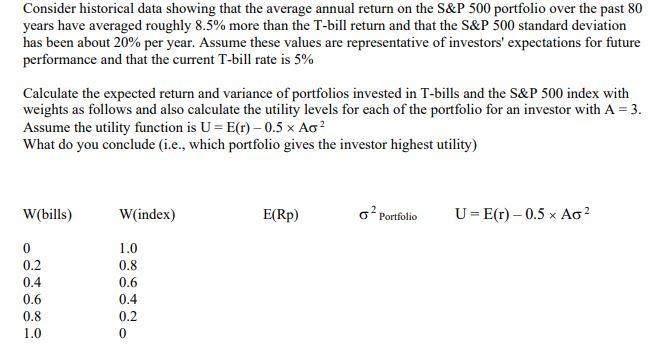
Consider historical data showing that the average annual return on the S&P 500 portfolio over the past 80 years have averaged roughly 8.5% more than the T-bill return and that the S&P 500 standard deviation has been about 20% per year. Assume these values are representative of investors' expectations for future performance and that the current T-bill rate is 5% Calculate the expected return and variance of portfolios invested in T-bills and the S&P 500 index with weights as follows and also calculate the utility levels for each of the portfolio for an investor with A = 3. Assume the utility function is U-E(r)-0.5 >
Step by Step Solution
There are 3 Steps involved in it
1 Expert Approved Answer
Step: 1 Unlock

Question Has Been Solved by an Expert!
Get step-by-step solutions from verified subject matter experts
Step: 2 Unlock
Step: 3 Unlock