

Question: Consider Table 1, which presents expected returns, standard deviations, and correlations for two stocks, stock 1, and stock 2, and for the riskless asset.
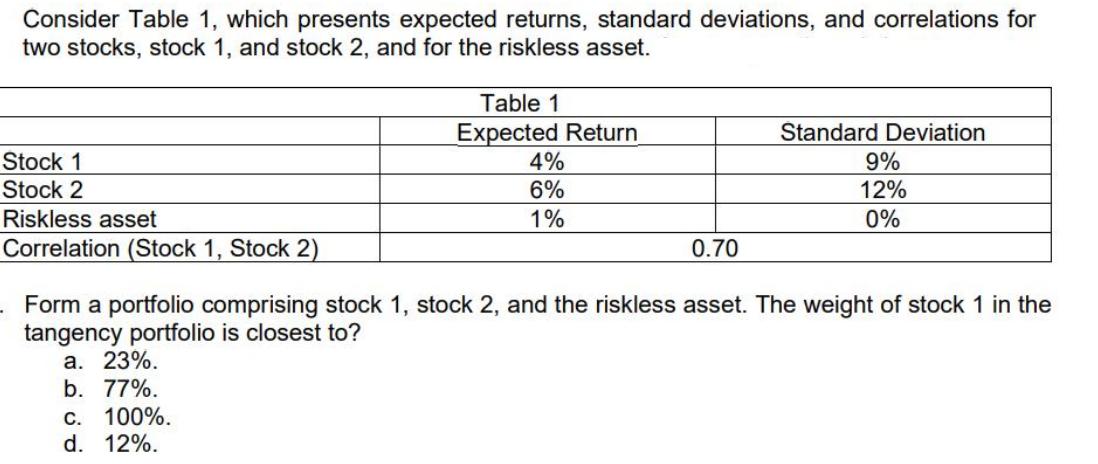
Consider Table 1, which presents expected returns, standard deviations, and correlations for two stocks, stock 1, and stock 2, and for the riskless asset. Stock 1 Stock 2 Riskless asset Correlation (Stock 1, Stock 2) Table 1 Expected Return 4% 6% 1% 0.70 Standard Deviation 9% 12% 0% Form a portfolio comprising stock 1, stock 2, and the riskless asset. The weight of stock 1 in the tangency portfolio is closest to? a. 23%. b. 77%. c. 100%. d. 12%.
Step by Step Solution
There are 3 Steps involved in it
The detailed answer for the above question is provided below Okay lets ... View full answer

Get step-by-step solutions from verified subject matter experts