

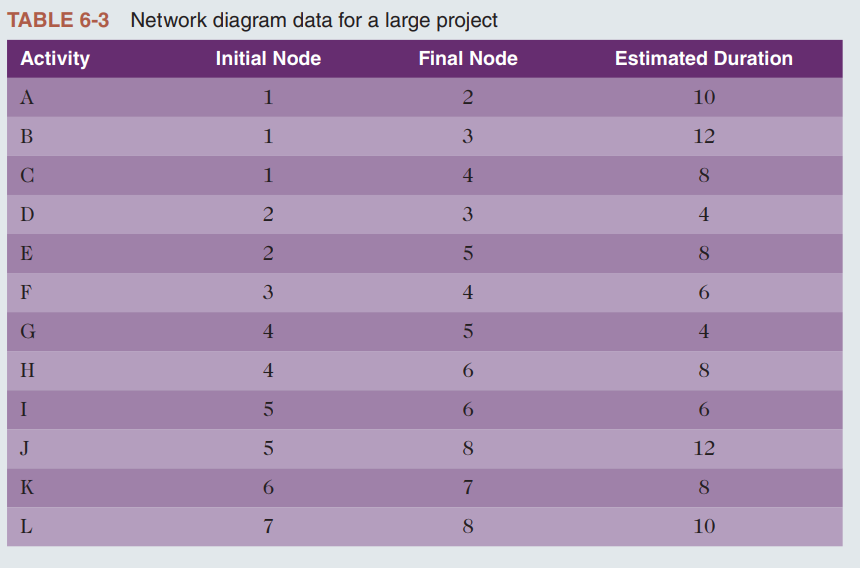
Question: Consider Table 6 - 3 . All duration estimates or estimated times are in weeks, and the network proceeds from Node 1 to Node 8
Consider Table All duration estimates or estimated times are in weeks, and the network proceeds from Node to Node Note that you can easily change this table to create multiple exercises.
Draw an AOA network diagram representing the project. Put the node numbers in circles and draw arrows from node to node, labeling each arrow with the activity letter and estimated time.
Identify all of the paths on the network diagram and note how long they are, using Figure as a guide for how to represent each path.
What is the critical path for this project and how long is it
What is the shortest possible time needed to complete this project?
Table
Network diagram data for a large project
Activity Initial Node Final Node Estimated Duration
A
B
C
D
E
F
G
H
I
J
K
L
Submit the diagram and answers to the questions in the assignment.
Given the following information for a oneyear project, answer the following questions. Recall that PV is the planned value, EV is the earned value, AC is the actual cost, and BAC is the budget at completion.
PV $
EV $
AC $
BAC $
What is the cost variance, schedule variance, cost performance index CPI and schedule performance index SPI for the project?
How is the project doing? Is it ahead of schedule or behind schedule? Is it under budget or over budget?
Use the CPI to calculate the estimate at completion EAC for this project. Is the project performing better or worse than planned?
Use the SPI to estimate how long it will take to finish this project.
Sketch the earned value chart for this project, using Figure as a guide.
Step by Step Solution
There are 3 Steps involved in it
1 Expert Approved Answer
Step: 1 Unlock

Question Has Been Solved by an Expert!
Get step-by-step solutions from verified subject matter experts
Step: 2 Unlock
Step: 3 Unlock