

Question: a. (20 points): Using Figure 6-2 in the textbook, enter the activities, their durations (in days), and their relationships in Project 2016. Use a project
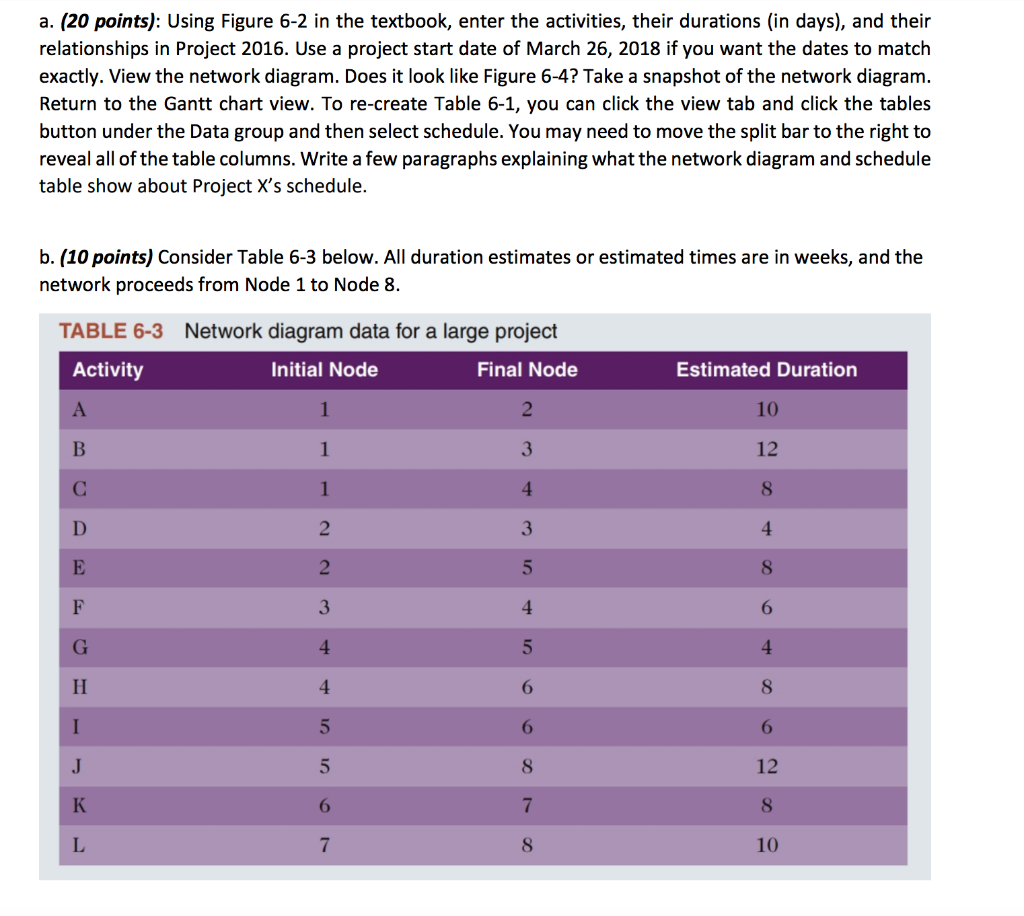
a. (20 points): Using Figure 6-2 in the textbook, enter the activities, their durations (in days), and their relationships in Project 2016. Use a project start date of March 26, 2018 if you want the dates to match exactly. View the network diagram. Does it look like Figure 6-4? Take a snapshot of the network diagram. Return to the Gantt chart view. To re-create Table 6-1, you can click the view tab and click the tables button under the Data group and then select schedule. You may need to move the split bar to the right to reveal all of the table columns. Write a few paragraphs explaining what the network diagram and schedule table show about Project X's schedule. b. (10 points) Consider Table 6-3 below. All duration estimates or estimated times are in weeks, and the network proceeds from Node 1 to Node 8. TABLE 6-3 Network diagram data for a large project Activity Initial Node Final Node Estimated Duration 10 12 3 3 8 12 8 10 a. Draw an AOA network diagram representing the project. Put the node numbers in circles and draw arrows from node to node, labeling each arrow with the activity letter and estimated time. b. Identify all of the paths on the network diagram and note how long they are, using Figure 6-8 as a guide for how to represent each path. c. What is the critical path for this project and how long is it? d. What is the shortest possible time needed to complete this project
Step by Step Solution
There are 3 Steps involved in it

Get step-by-step solutions from verified subject matter experts