

Question: Consider table data https://docs.google.com/spreadsheets/d/1zVqU4gzNPcdBPvVE3Xvetvpjxy2noYd8nqYIs5hm9js/edit?usp=sharing Let represent the difference in expected income between the population of treated (participant) versus untreated (non-participant) households. As a first step
Consider table data
https://docs.google.com/spreadsheets/d/1zVqU4gzNPcdBPvVE3Xvetvpjxy2noYd8nqYIs5hm9js/edit?usp=sharing
Let represent the difference in expected income between the population of treated (participant) versus untreated (non-participant) households. As a first step in your analysis, calculate , the difference in mean income between the sample of treated versus untreated households.is the sample estimate of the population parameter .
Calculate and report: i) Mean income of the treated group, ii) Mean income of the untreated group and iii) .
Calculate and report the standard error of .
Compute a 95% confidence interval for your estimate, .
Compute the t-statistic for . Does the t-statistic tell us that is different from zero at a 5% significance level?
Now run the following bivariate regression of farm income on treatment status:
Report your estimates of the parameters in the regression, and , and contrast this result with your estimated , the confidence intervals from part c., and the hypothesis test from part d.
Do you believe that is an unbiased estimate of the causal impact of the program? Justify your answer. Make sure your answer includes a discussion of how individuals ended up in the treatment and control groups. We encourage you to come up with specific examples to illustrate your argument.
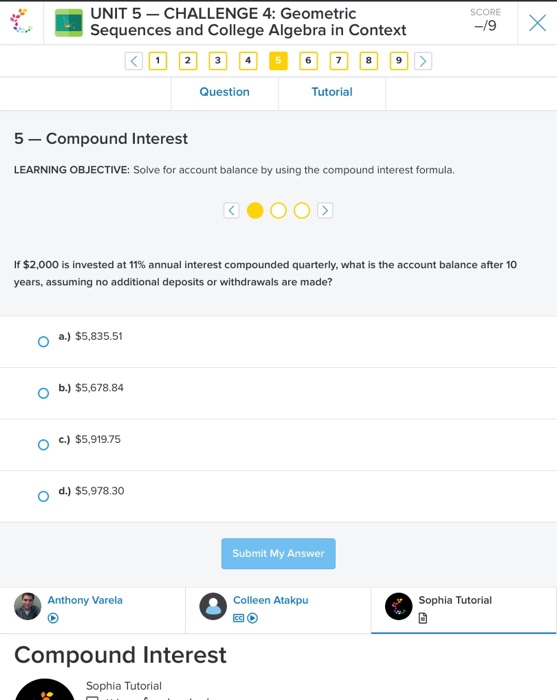
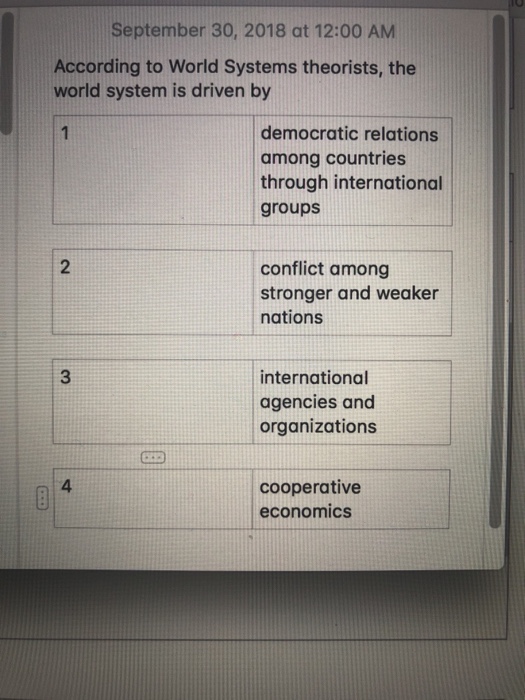
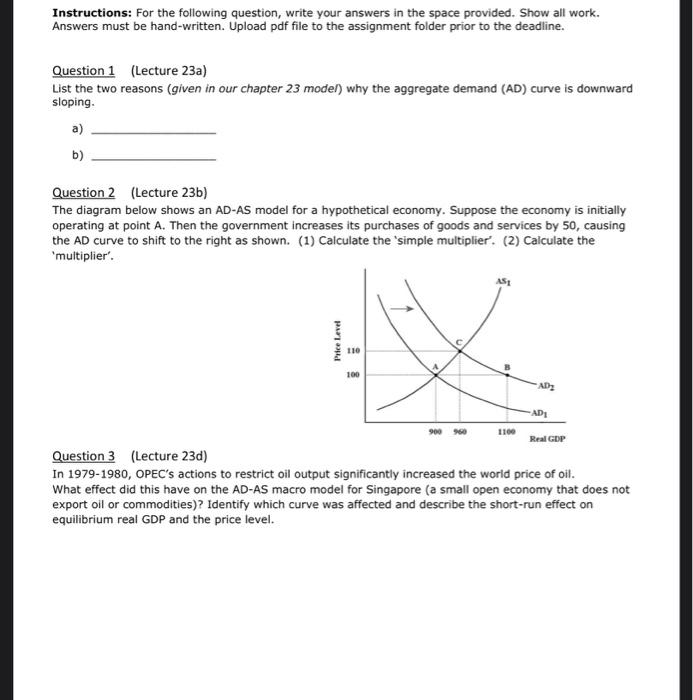
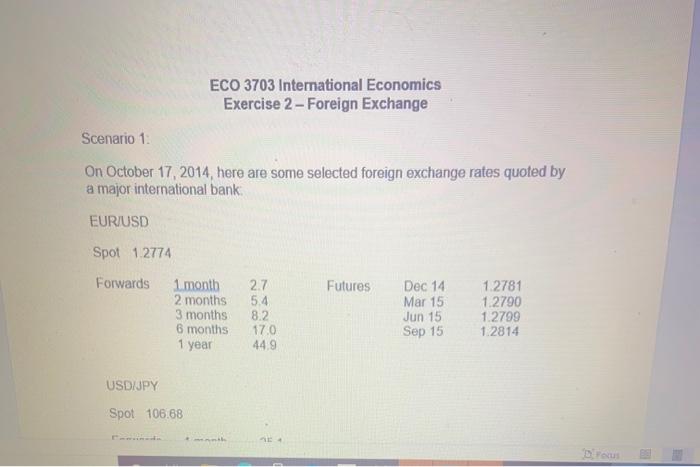
UNIT 5 - CHALLENGE 4: Geometric SCORE Sequences and College Algebra in Context -/9 X Question Tutorial 5 - Compound Interest LEARNING OBJECTIVE: Solve for account balance by using the compound interest formula. .OOD If $2,000 is invested at 11% annual interest compounded quarterly, what is the account balance after 10 years, assuming no additional deposits or withdrawals are made? (a.) $5,835.51 ( b.) $5,678.84 ( ) $5,919.75 ( d.) $5,978.30 Submit My Answer Anthony Varela Colleen Atakpu Sophia Tutorial Compound Interest Sophia TutorialSeptember 30, 2018 at 12:00 AM According to World Systems theorists, the world system is driven by democratic relations among countries through international groups 2 conflict among stronger and weaker nations international agencies and organizations 4 cooperative economicsInstructions: For the following question, write your answers in the space provided. Show all work. Answers must be hand-written. Upload pdf file to the assignment folder prior to the deadline. Question 1 (Lecture 23a) List the two reasons (given in our chapter 23 model) why the aggregate demand (AD) curve is downward sloping. a) Question 2 (Lecture 23b) The diagram below shows an AD-AS model for a hypothetical economy. Suppose the economy is initially operating at point A. Then the government increases its purchases of goods and services by 50, causing the AD curve to shift to the right as shown. (1) Calculate the 'simple multiplier". (2) Calculate the "multiplier'. Price Level 110 100 -ADT AD 1106 Real GDP Question 3 (Lecture 23d) In 1979-1980, OPEC's actions to restrict oil output significantly increased the world price of oil. What effect did this have on the AD-AS macro model for Singapore (a small open economy that does not export oil or commodities)? Identify which curve was affected and describe the short-run effect on equilibrium real GDP and the price level.ECO 3703 International Economics Exercise 2-Foreign Exchange Scenario 1: On October 17, 2014, here are some selected foreign exchange rates quoted by a major international bank EUR/USD Spot 1.2774 Forwards 1 month 2.7 Futures Dec 14 1.2781 2 months 5.4 Mar 15 1.2790 3 months 8.2 Jun 15 1.2799 6 months 17.0 Sep 15 1 2814 1 year 44.9 USDIPY Spot 106:68
Step by Step Solution
There are 3 Steps involved in it

Get step-by-step solutions from verified subject matter experts