

Question: ..................... Consider the accompanying 2 x 3 table displaying the sample proportions that fell in the various combinations of categories (e.g., 12% of those in
.....................
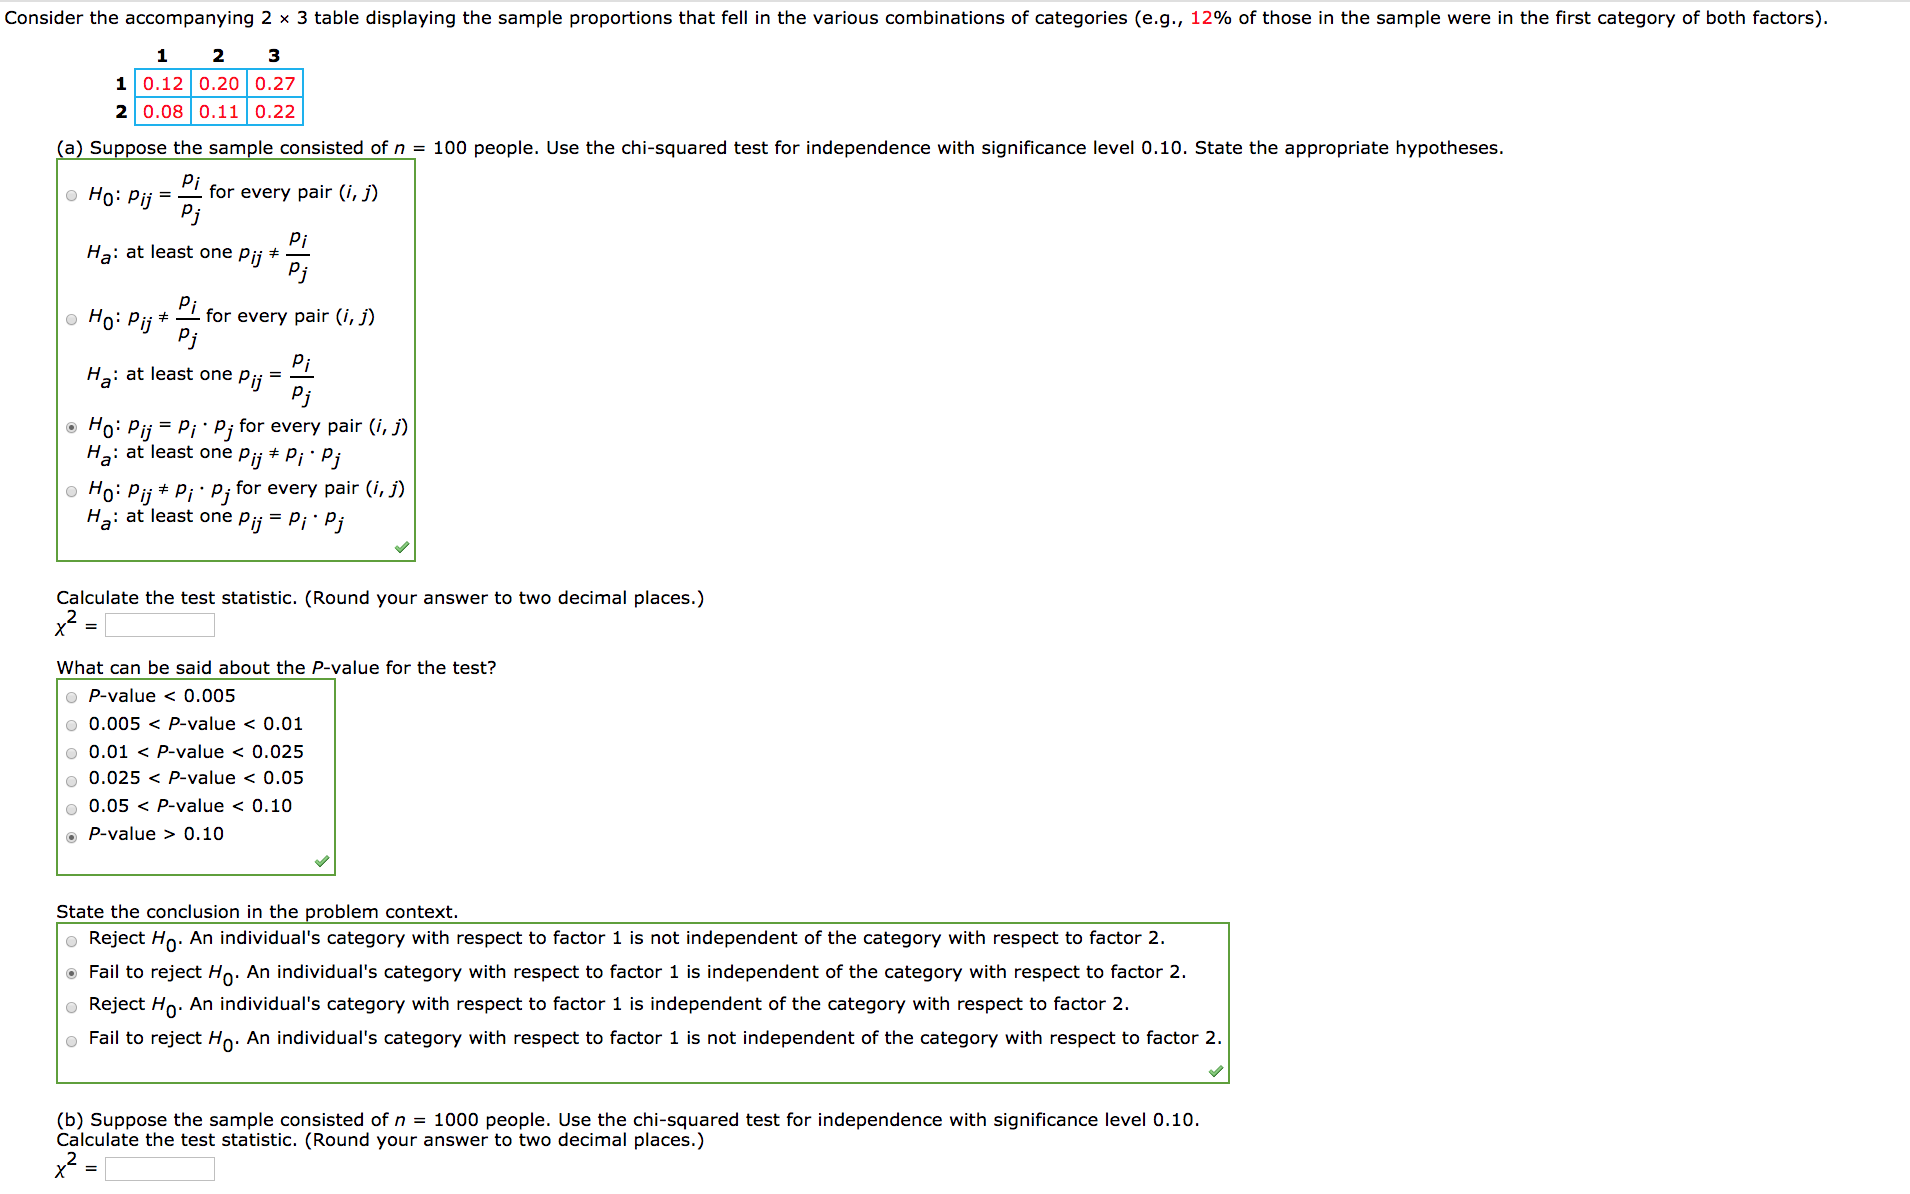
Consider the accompanying 2 x 3 table displaying the sample proportions that fell in the various combinations of categories (e.g., 12% of those in the sample were in the first category of both factors). 1 2 3 1 0.12 0.20 0.27 2 0.08 0.11 0.22 (a) Suppose the sample consisted of n = 100 people. Use the chi-squared test for independence with significance level 0.10. State the appropriate hypotheses. . Ho: Pij = - for every pair (i, j) P j Ha: at least one pij * Pi . Ho: Pij * Pj Pi for every pair (i, j) Ha: at least one Pij= Pi Pi . Ho: Pij = Pi Pi for every pair (i, j) Ha: at least one pij * Pi . Pi o Ho: Pij * Pi . P; for every pair (i, j) Ha: at least one pij = Pi Pi Calculate the test statistic. (Round your answer to two decimal places.) X2 = What can be said about the P-value for the test? o P-value 0.10 State the conclusion in the problem context. . Reject Ho. An individual's category with respect to factor 1 is not independent of the category with respect to factor 2. . Fail to reject Ho. An individual's category with respect to factor 1 is independent of the category with respect to factor 2. Reject Ho. An individual's category with respect to factor 1 is independent of the category with respect to factor 2. . Fail to reject Ho. An individual's category with respect to factor 1 is not independent of the category with respect to factor 2. (b) Suppose the sample consisted of n = 1000 people. Use the chi-squared test for independence with significance level 0.10. Calculate the test statistic. (Round your answer to two decimal places.) X =
Step by Step Solution
There are 3 Steps involved in it

Get step-by-step solutions from verified subject matter experts