

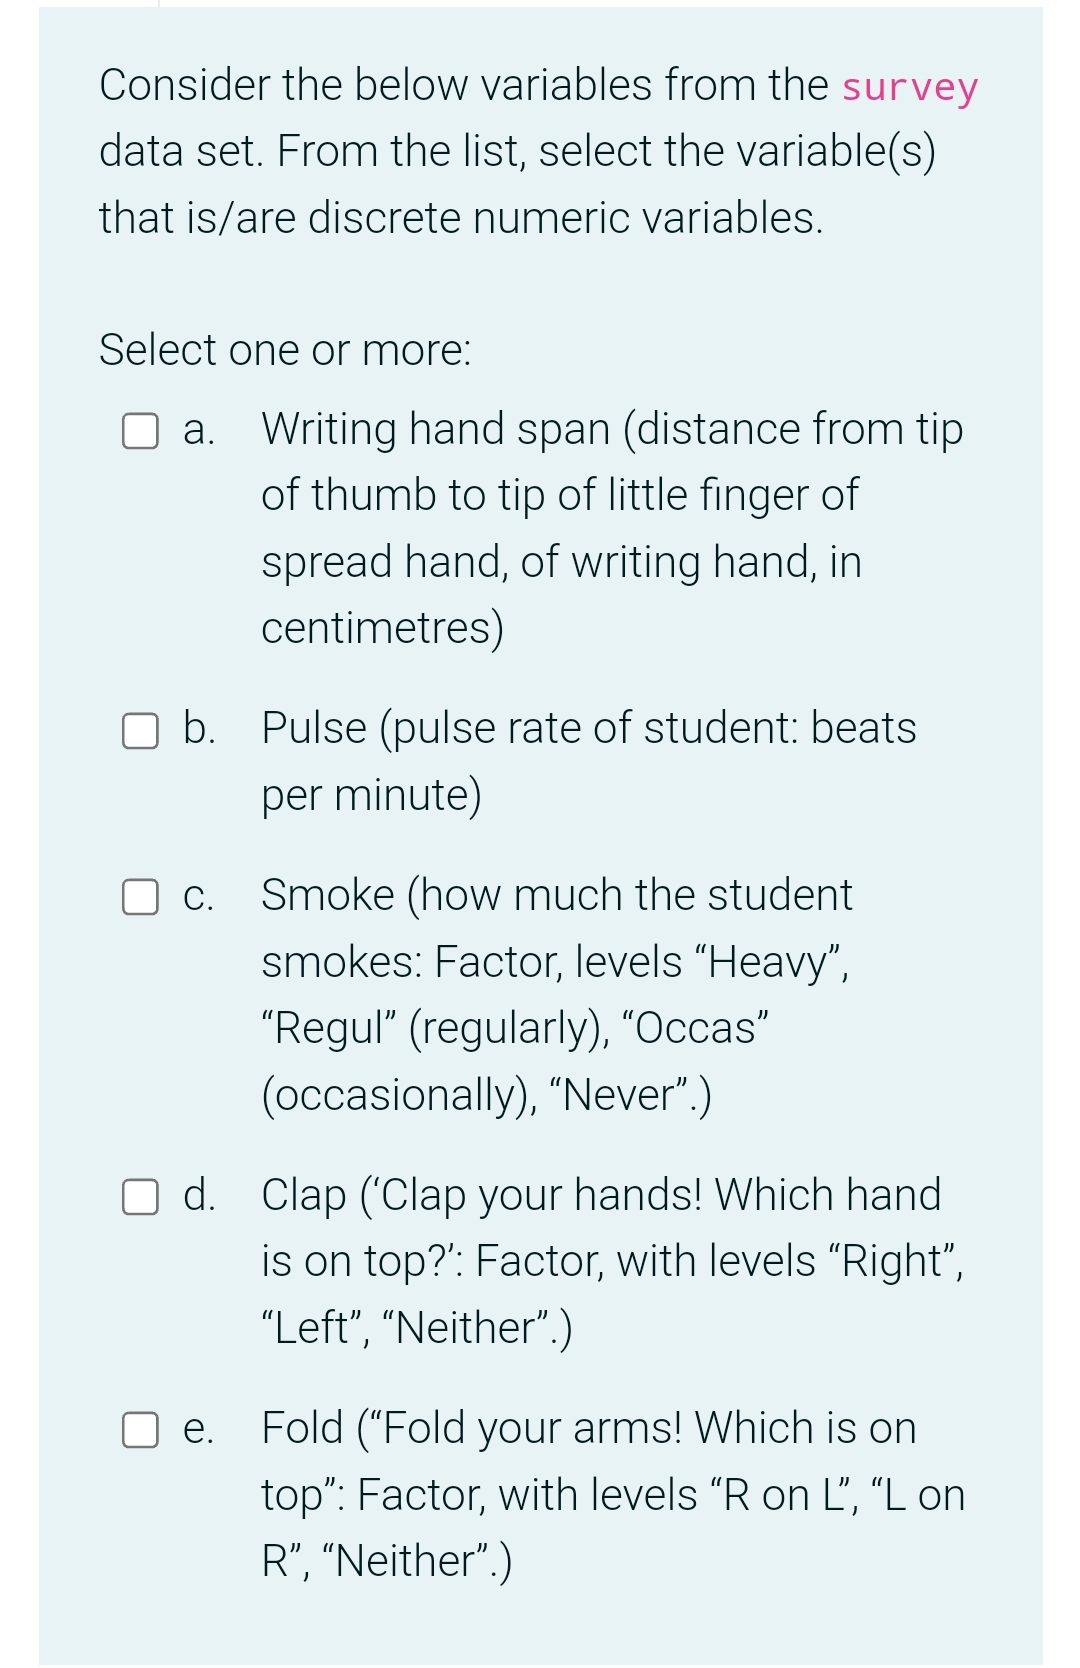
Question: Consider the below variables from the survey data set. From the list, select the variable(s) that is/are nominal categorical variables. Select one or more: a.


![one OF more: C]a. C]e. Writing hand span (distance from tip of](https://s3.amazonaws.com/si.experts.images/answers/2024/06/6679f05512026_4126679f054d65d5.jpg)
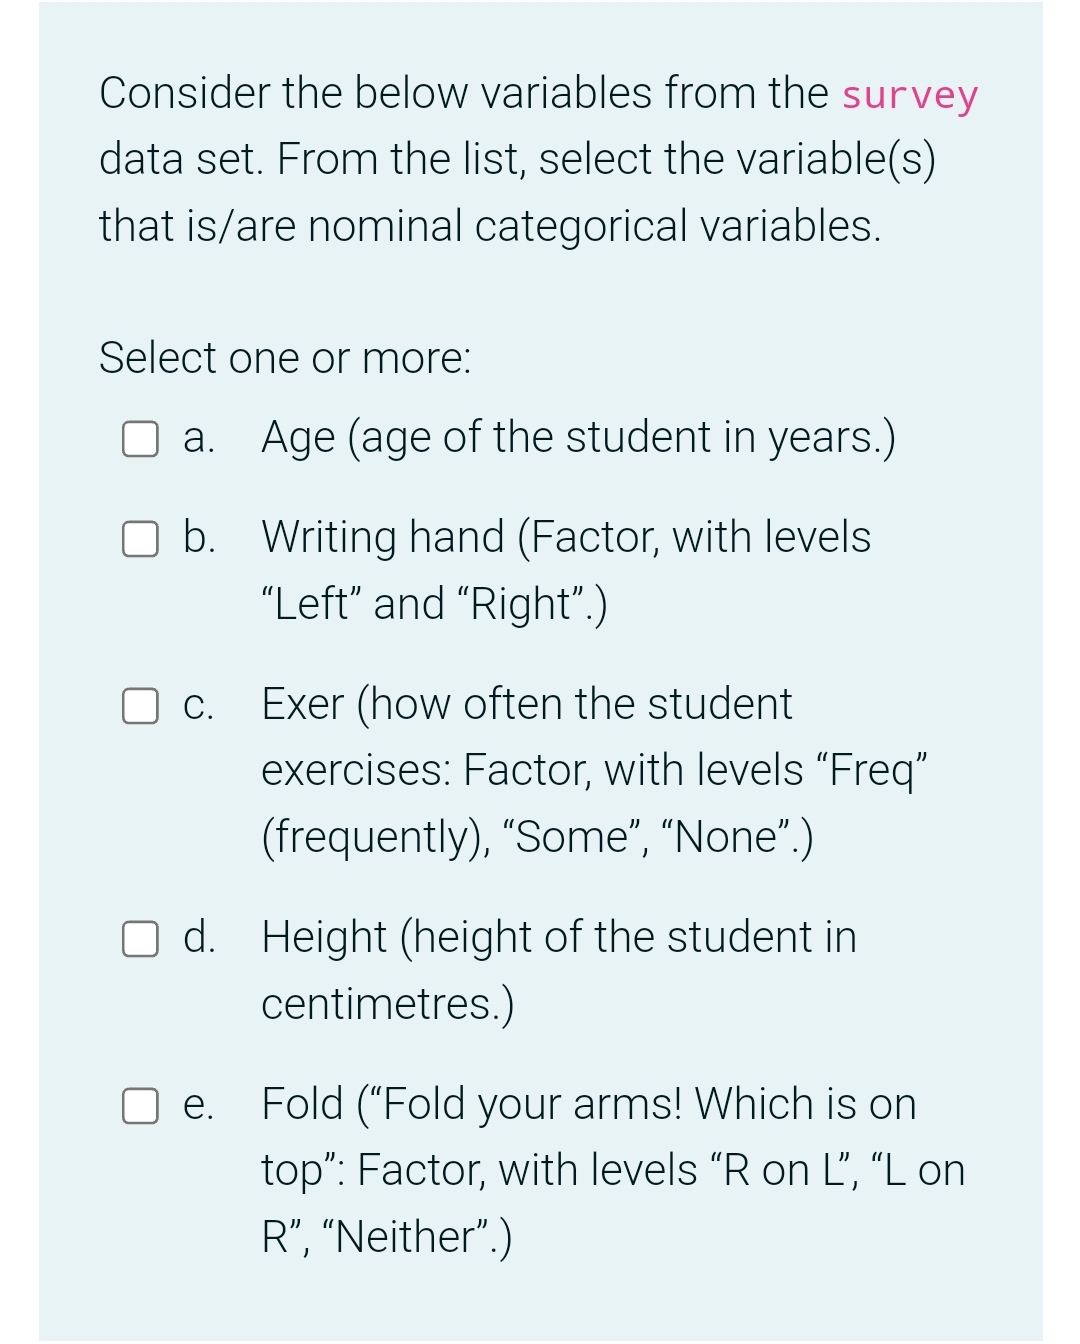


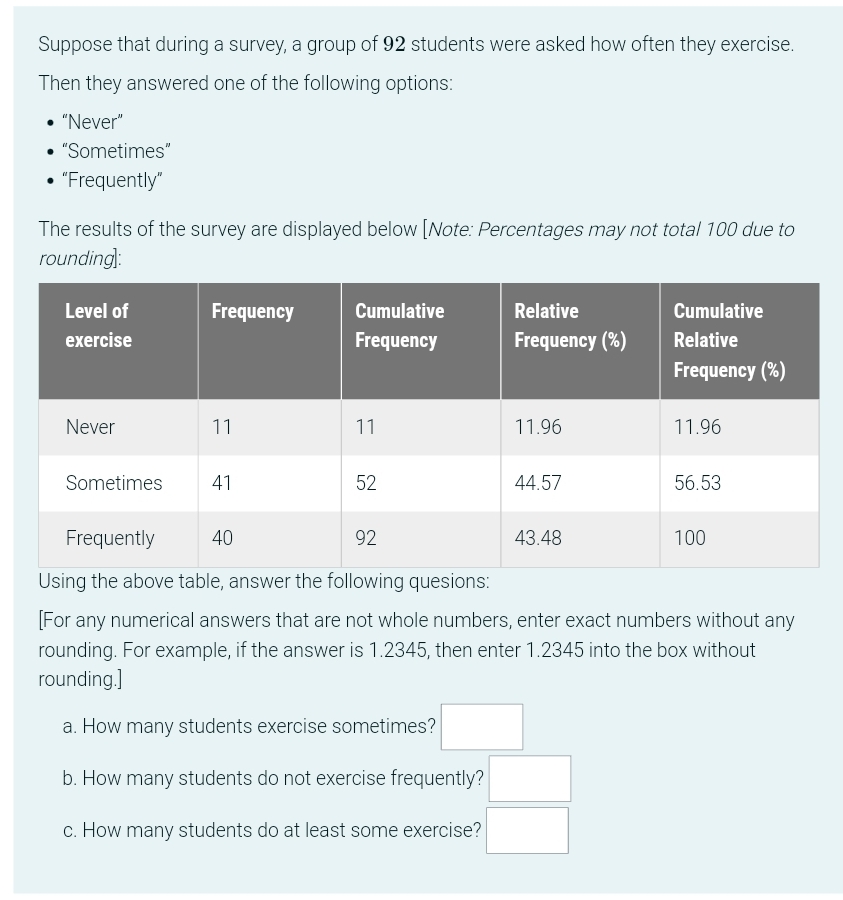

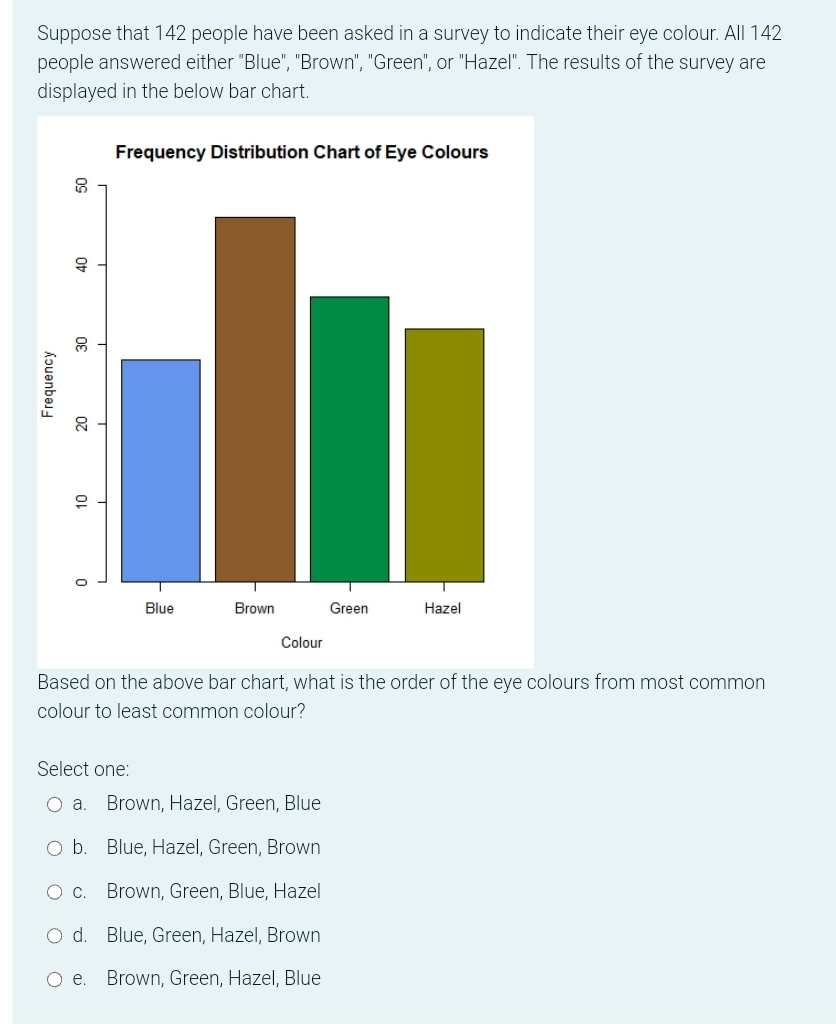
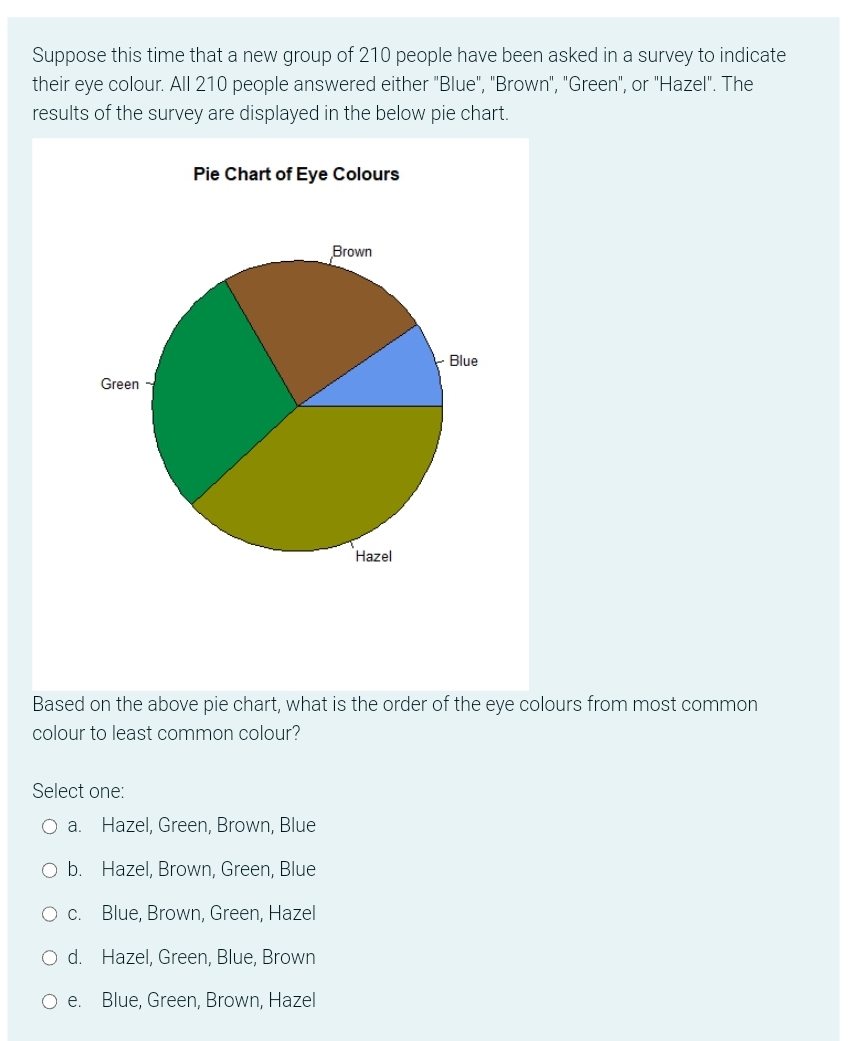
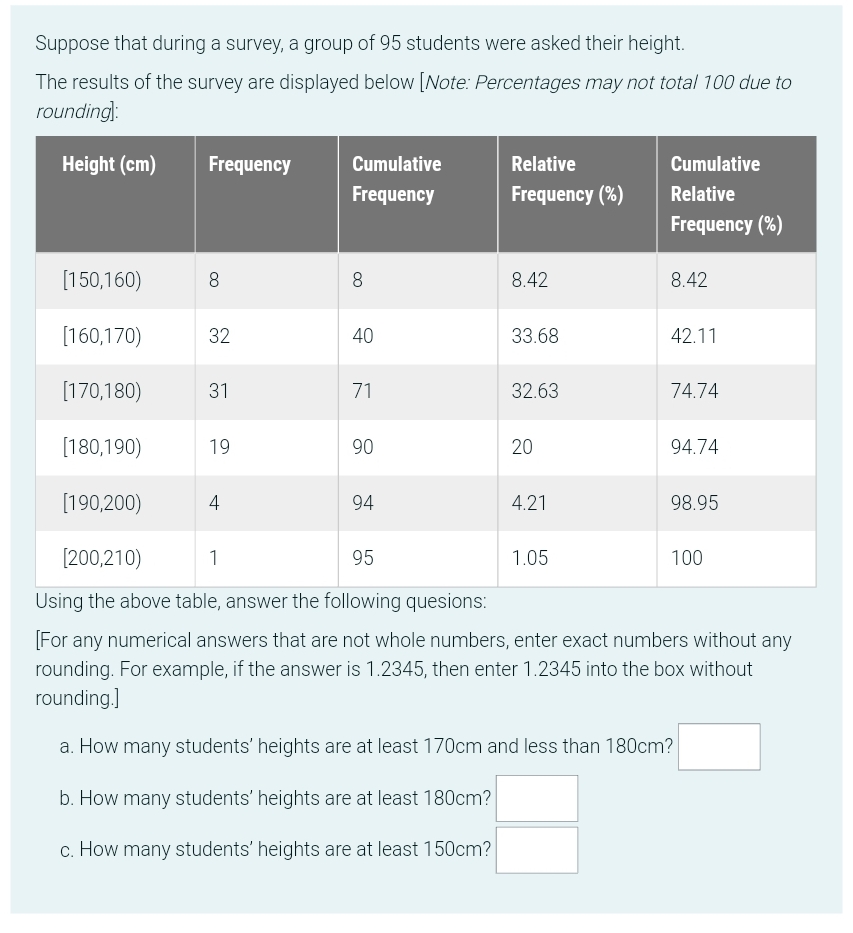
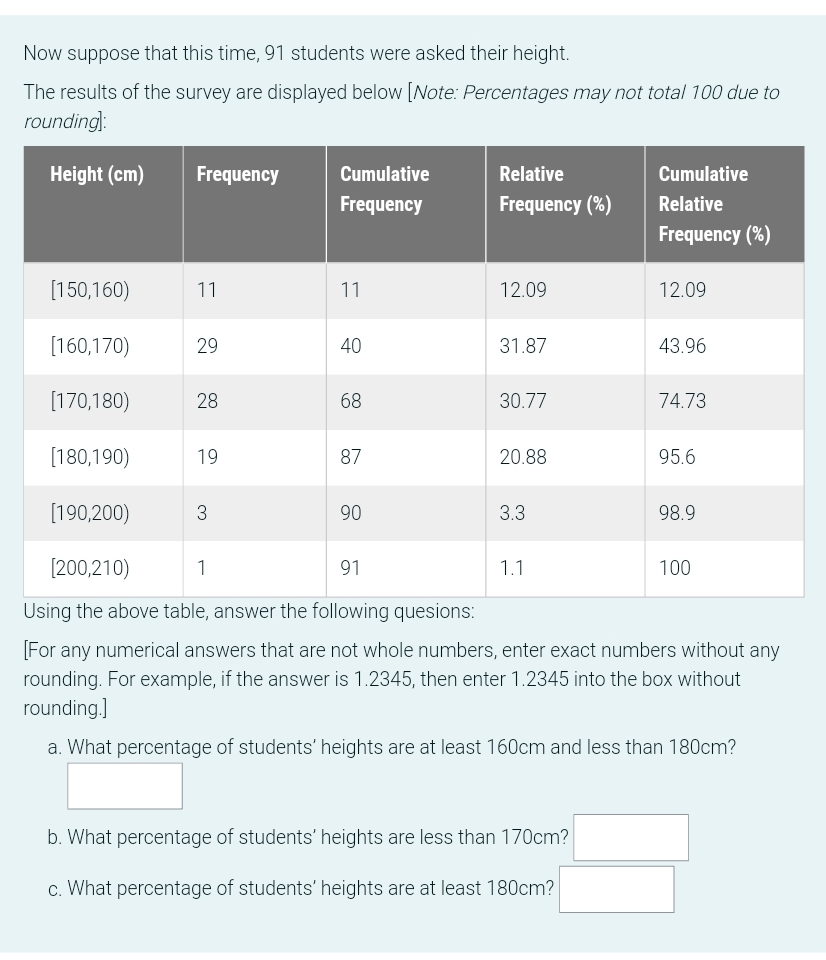
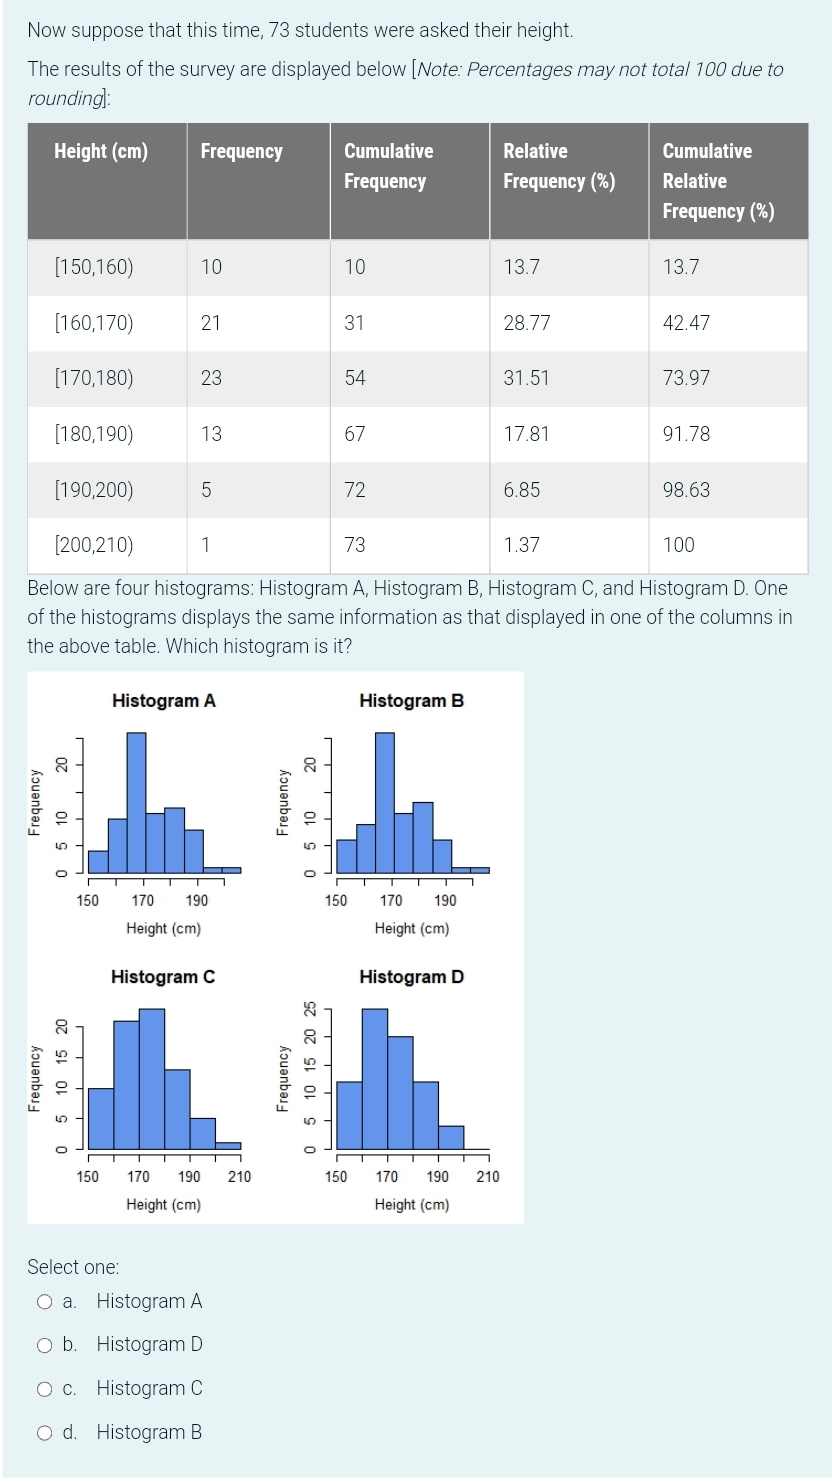
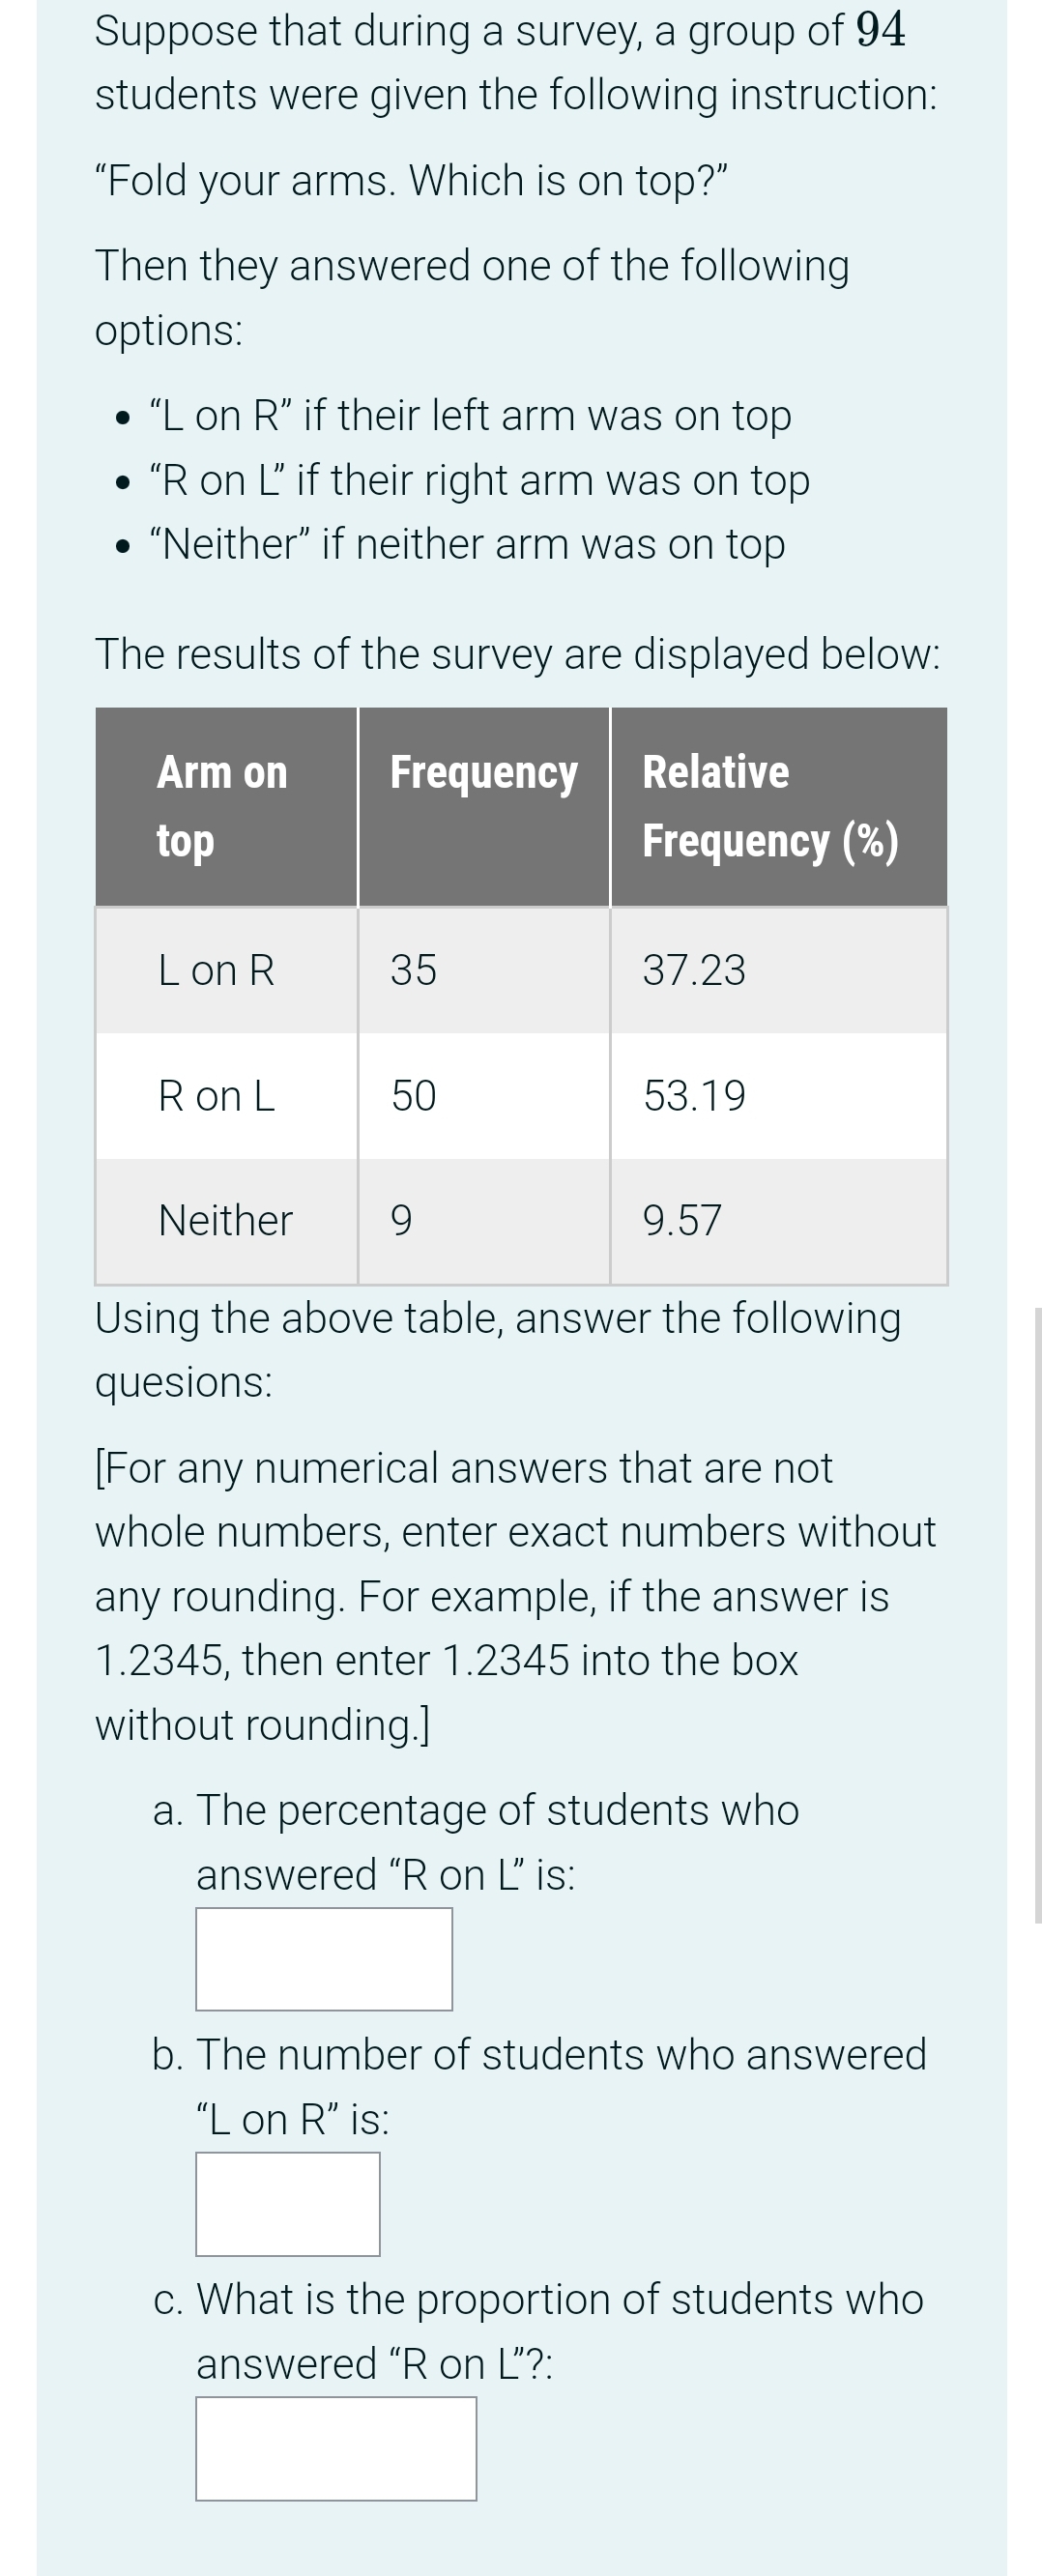
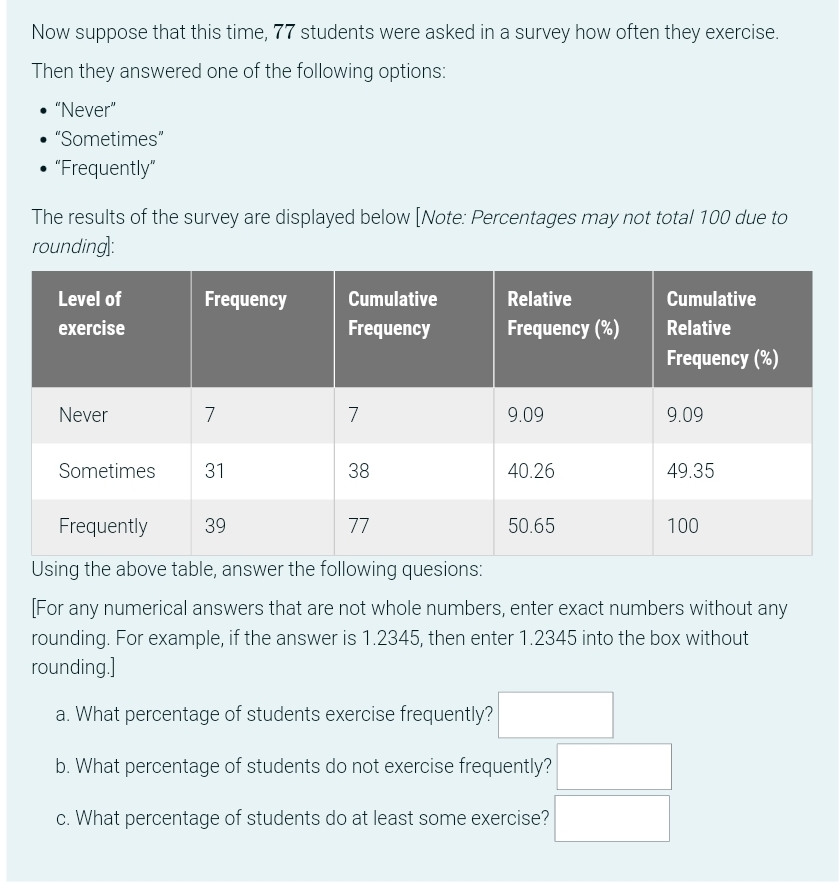
Consider the below variables from the survey data set. From the list, select the variable(s) that is/are nominal categorical variables. Select one or more: a. Age (age of the student in years.) O b. Writing hand (Factor, with levels "Left" and "Right".) O c. Exer (how often the student exercises: Factor, with levels "Freq" (frequently), "Some", "None".) O d. Height (height of the student in centimetres.) O e. Fold ("Fold your arms! Which is on top": Factor, with levels "R on L", "L on R", "Neither". )Consider the below variables from the survey data set. From the list, select the variable(s) that is/are discrete numeric variables. SGIGCt one OF more: C]a. C]e. Writing hand span (distance from tip of thumb to tip of little finger of spread hand, of writing hand, in centimetres) Pulse (pulse rate of student: beats per minute) Smoke (how much the student smokes: Factor, levels "Heavy\Suppose that during a survey, a group of 94 students were given the following instruction: "Fold your arms. Which is on top?" Then they answered one of the following options: . "L on R" if their left arm was on top . "R on L\" if their right arm was on top . "Neither" if neither arm was on top The results of the survey are displayed below: Relative top Frequency (/o) LonR 35 3723 R on L 50 53.19 Neither 9 9.57 Using the above table, answer the following quesions: [For any numerical answers that are not whole numbers, enter exact numbers without any rounding. For example, if the answer is 1.2345, then enter 1.2345 into the box without rounding] a. The percentage of students who answered \"R on L" is: j b. The number of students who answered "L on R" is: c. What is the proportion of students who answered \"R on L"?: Suppose that during a survey, a group of 92 students were asked how often they exercise. Then they answered one of the following options: . "Never" . "Sometimes" . "Frequently" The results of the survey are displayed below [ Note: Percentages may not total 100 due to rounding]: Level of Frequency Cumulative Relative Cumulative exercise Frequency Frequency (%) Relative Frequency (%) Never 11 11 11.96 11.96 Sometimes 41 52 44.57 56.53 Frequently 40 92 43.48 100 Using the above table, answer the following quesions: [For any numerical answers that are not whole numbers, enter exact numbers without any rounding. For example, if the answer is 1.2345, then enter 1.2345 into the box without rounding.] a. How many students exercise sometimes? b. How many students do not exercise frequently? c. How many students do at least some exercise?Now suppose that this time, 77 students were asked in a survey how often they exercise. Then they answered one of the following options: - "Never\" - "Sometimes\" - "Frequently" The results of the survey are displayed below [Note Percentages may not rota! 100 due to rounding]: Level of Cumulative Relative Cumulative exercise Frequency Frequency (%} Relative Frequency [%) Never 7 7 9.09 9.09 Sometimes 3i 38 40.26 49.35 Frequently 39 7? 50.65 100 Using the above table, answerthe following quesions: [For any numerical answers that are not whole numbers, enter exact numbers without any rounding. For example, if the answer is 1.2345, then enter 'l .2345 into the box without rounding] a. What percentage of students exercise frequently? b. What percentage of students do not exercise frequently? c. What percentage of students do at least some exercise? Suppose that 142 people have been asked in a survey to indicate their eye colour. All 142 people answered either "Blue", "Brown", "Green". or "Hazel". The results ofthe survey are displayed in the below bar chart. Frequency Distribution Chart of Eye Colours 40 50 30 Frequency 10 Blue Brown Green Hazel Colour Based on the above bar chart. what is the order of the eye colours from most common colour to least common colour? Select one: C1 a. Brown, Hazel. Green Blue 0 b. Blue,Hazel,Green, Brown C] c. Brown, Green] Blue, Hazel C: d. Blue, Green. Hazel, Brown D e. Brown, Green Hazell Blue Suppose this time that a new group of 210 people have been asked in a survey to indicate their eye colour. All 210 people answered either "Blue", "Brown", "Green". or "Hazel". The results of the survey are displayed in the below pie chart. Pie Chart of Eye Colours Blue Green Based on the above pie chart, what is the order ofthe eve colours from most common colour to least common colour? Select one: Q a. Hazel, Green. Brown, Blue 0 b. Hazel, Brown. Green, Blue \"\"1 c. Blue, Brown, Green, Hazel Q d. Hazel; Green. Blue; Brown 0 e. Blue, Green, Brown, Hazel Suppose that during a survey, a group of 95 students were asked their height. The results of the survey are displayed below [Note Percentages may not tots! 100 due to rounding]: Cumulative Relative Cumulative Frequency Frequency 11%} Relative Frequency ('53) {150.163} 8 8 8.42 8.42 [160.173] 32 40 33.68 42.11 [1 Y0.1 82)) 31 71 32.63 74.?4 {180.193} 19 90 20 94.?4 [190.203] 4 94 4.21 98.95 {200.213} 1 95 1.05 100 Using the above table, answerthe following quesions: [For any numerical answers that are not whole numbers, enter exaot numbers without any rounding. For example, if the answer is 1 .2345 then enter 1 .2845 into the box without rounding] a. How many students' heights are at least 170cm and less than 180cm? b. How many students' heights are at least 180cm? o. How many students' heights are at least 150cm? Now suppose that this time. 91 students were asked their height. The results of the survey are displayed below [Note Percentages may not tote! 1'00 due to rounding]: Cumulative Relative Cumulative Frequency Frequency {35) Relative Frequency (ta) [150,\" 60) 11 11 12.09 12.09 [160.\" 7'0\" 29 40 31.87 43.96 [1?0,' 80: 28 68 30.77 74.?3 [180.\" 90' 19 87' 20.88 95.6 [190200; 3 90 3.3 98.9 [200210 1 91 1.1 100 Using the above table. answerthe following quesions: [For any numerical answers that are not whole numbers, enter exact numbers without any rounding. For example, ifthe answer is 1 .2345, then enter 1 .2345 into the box without rounding] a. What percentage of students' heights are at least 160cm and less than 180cm? b. What percentage of students' heights are less than 1700m'? c. What percentage of students' heights are at least 180cm? Now suppose that this time, 73 students were asked their height. The results of the survey are displayed below [ Note: Percentages may not total 100 due to rounding]: Height (cm) Frequency Cumulative Relative Cumulative Frequency Frequency (%) Relative Frequency (%) [150,160) 10 10 13.7 13.7 [160,170) 21 31 28.77 42.47 [170,180) 23 54 31.51 73.97 [180,190) 13 67 17.81 91.78 [190,200) 5 72 6.85 98.63 (200,210) - 73 1.37 100 Below are four histograms: Histogram A, Histogram B, Histogram C, and Histogram D. One of the histograms displays the same information as that displayed in one of the columns in the above table. Which histogram is it? Histogram A Histogram B 8 Frequency Frequency 5 10 0 O 150 170 190 150 170 190 Height (cm) Height (cm) Histogram C Histogram D 5 10 15 20 25 Frequency Frequency 5 0 150 170 210 150 170 190 210 Height (cm) Height (cm) Select one: O a. Histogram A O b. Histogram D O C. Histogram C O d. Histogram B
Step by Step Solution
There are 3 Steps involved in it

Get step-by-step solutions from verified subject matter experts