

Consider the box plot and choose the correct options. The median of the data is necessarily
No answer yet for this question.
Ask a Tutor
Question:
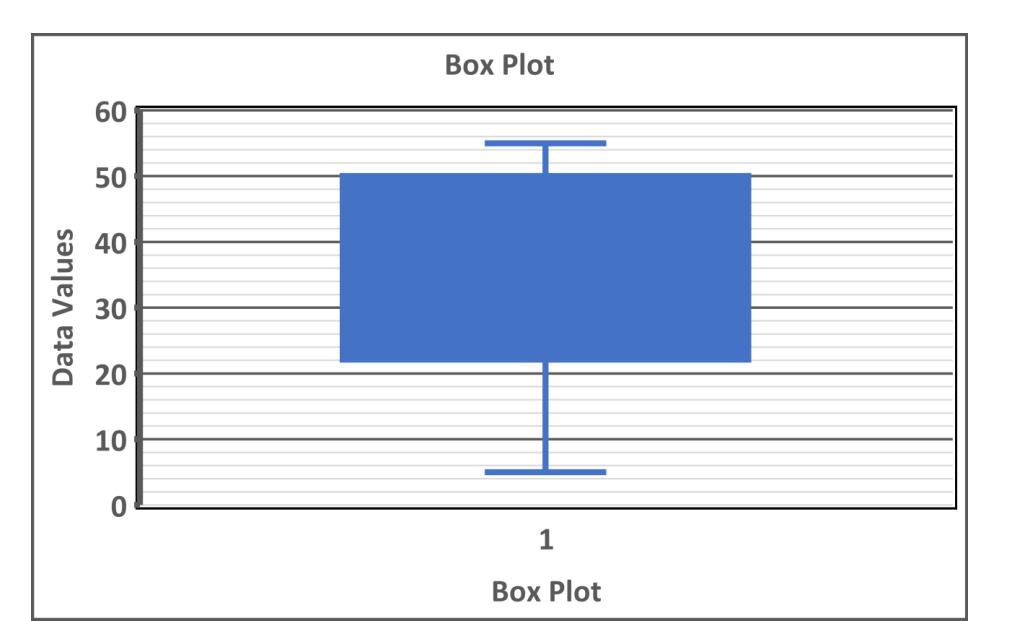
Consider the box plot and choose the correct options.
❑ The median of the data is necessarily equal to 37.5.
❑ The interquartile range of the given data is 28.
❑ There is no outlier in the dataset plotted in the box plot.
❑ Mode of the dataset will necessarily lie in [50, 55]
Expert Answer:

Related Book For 

Business Statistics A Decision Making Approach
ISBN: 9780133021844
9th Edition
Authors: David F. Groebner, Patrick W. Shannon, Phillip C. Fry
Posted Date:
