

Question: Consider the boxplot below. 10 2! 3f 47 62 I I | | | l l 10 20 30 40 50 60 70 data Q
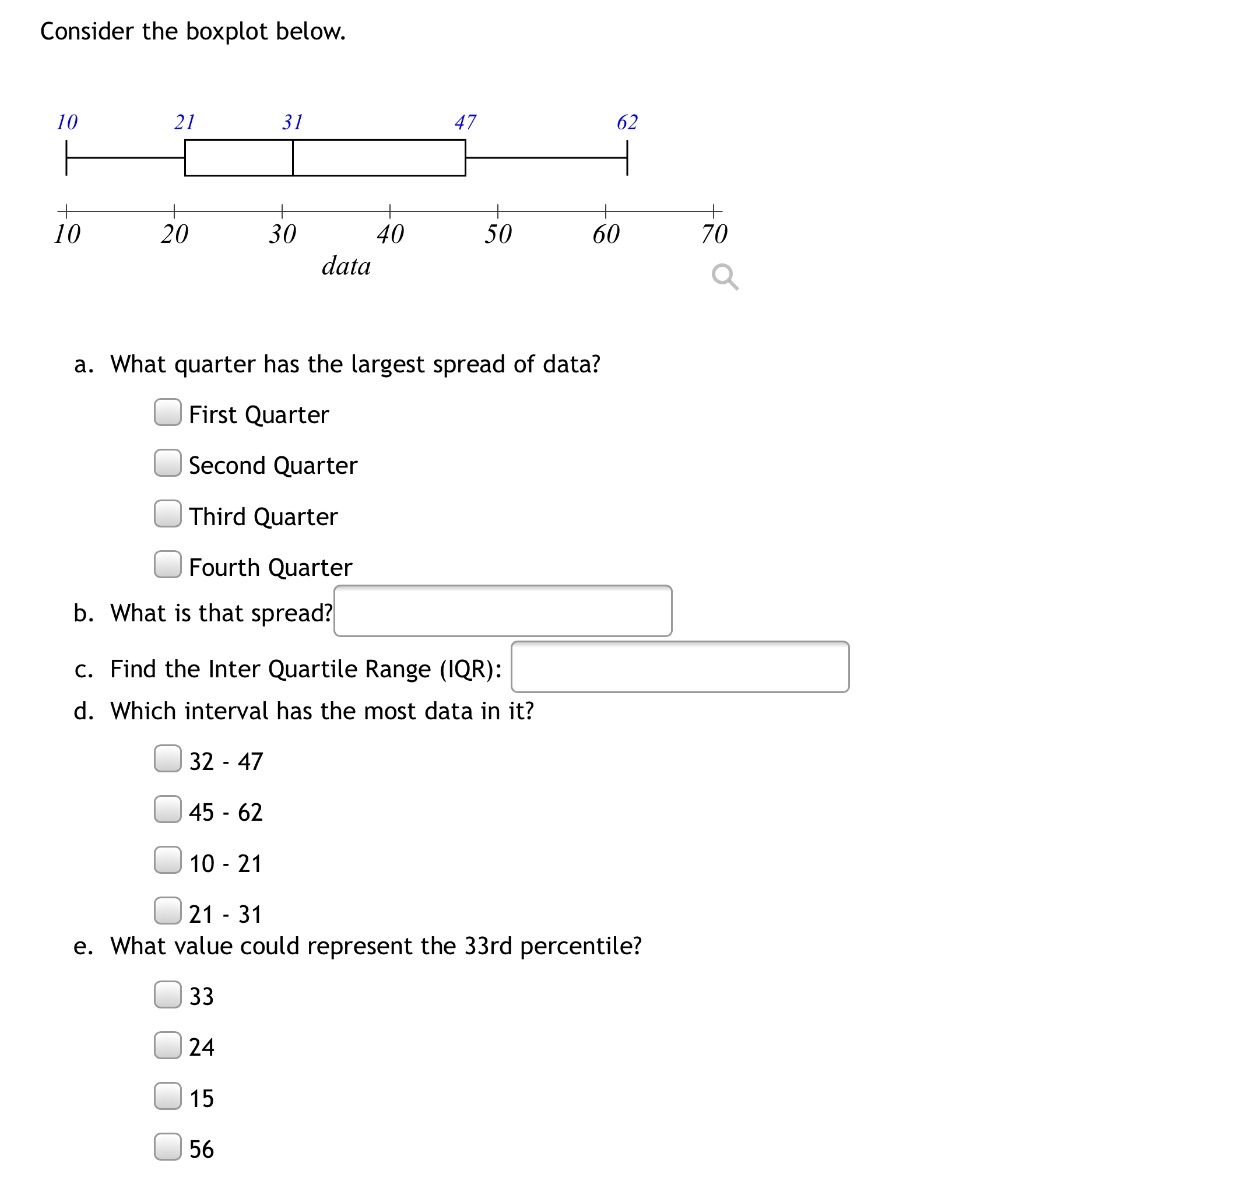
Consider the boxplot below. 10 2! 3f 47 62 I I | | | l l 10 20 30 40 50 60 70 data Q a. What quarter has the largest spread of data? C] First Quarter [3 Second Quarter [3 Third Quarter [3 Fourth Quarter c. Find mam Range mm: d. Which interval has the most data in it? C] 32 - 47 C] 45 - 62 D10 - 21 C] 21 - 31 e. What value could represent the 33rd percentile
Step by Step Solution
There are 3 Steps involved in it
1 Expert Approved Answer
Step: 1 Unlock

Question Has Been Solved by an Expert!
Get step-by-step solutions from verified subject matter experts
Step: 2 Unlock
Step: 3 Unlock