

Question: Consider the boxplot below. 3 10 20 a. What quarter has the smallest spread of data? O Fourth O Second Third First b. What
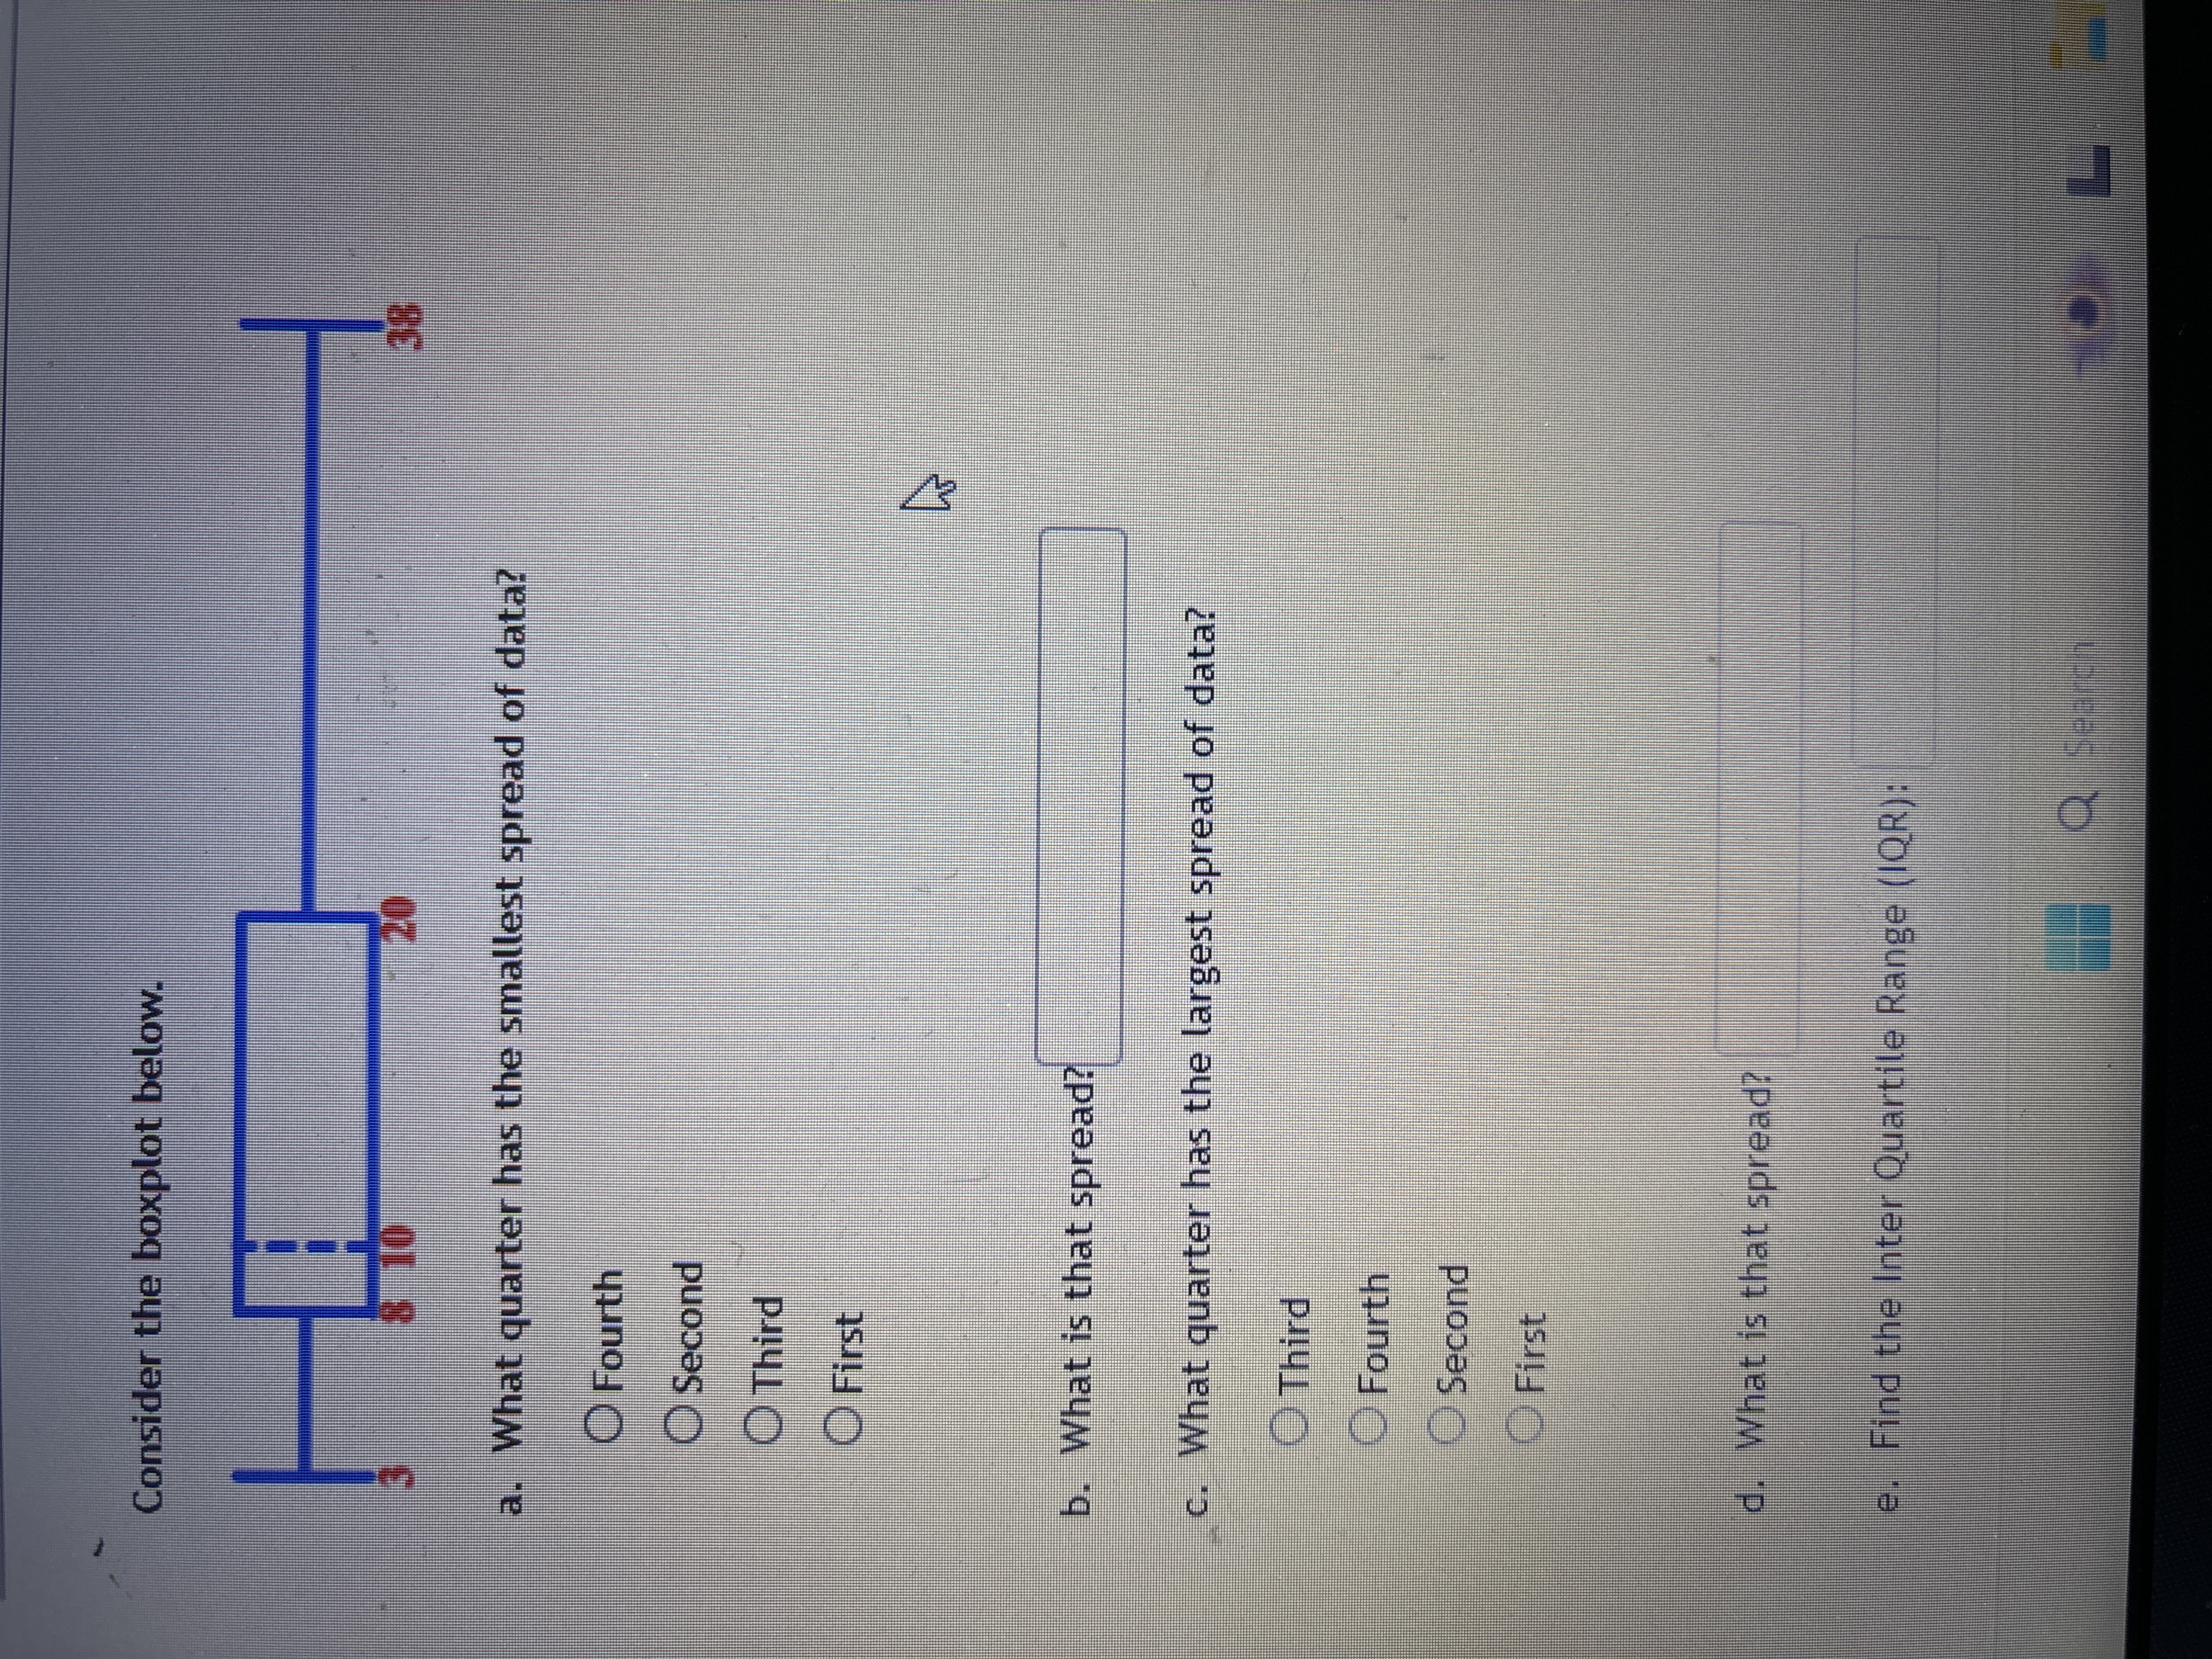
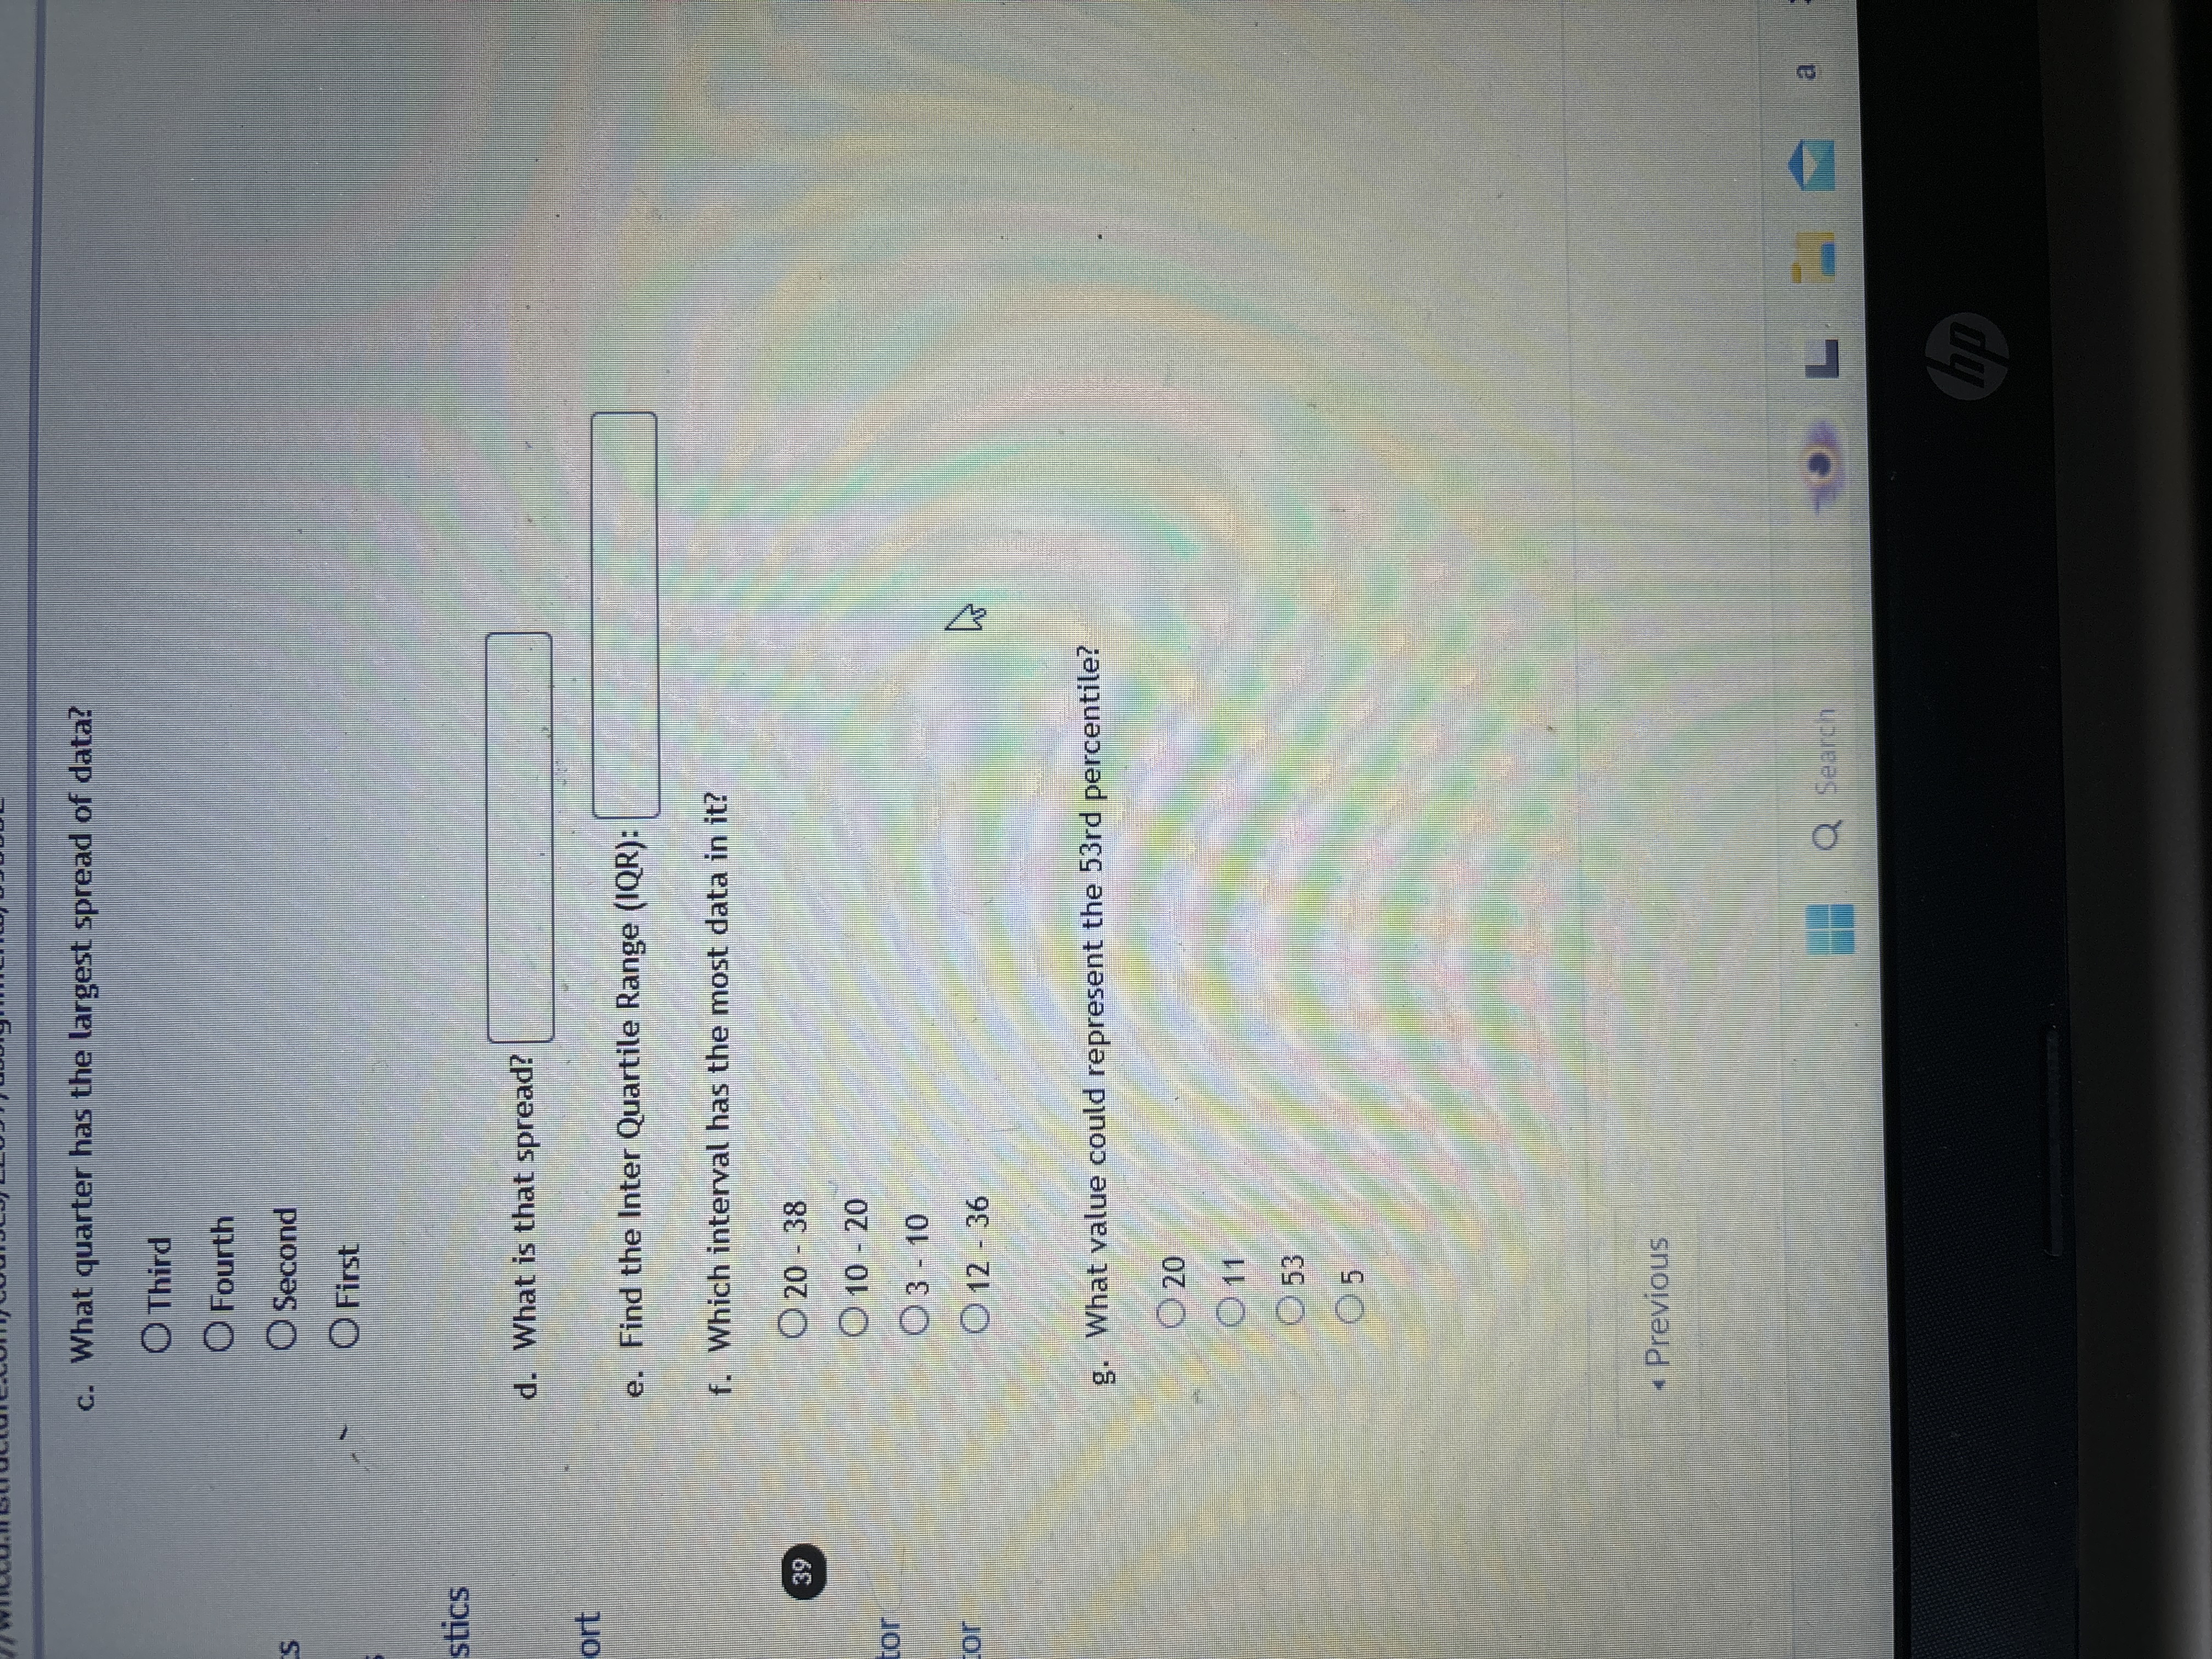
Consider the boxplot below. 3 10 20 a. What quarter has the smallest spread of data? O Fourth O Second Third First b. What is that spread? c. What quarter has the largest spread of data? Third Fourth Second First d. What is that spread? e. Find the Inter Quartile Range (IQR): Q Search 38 S c. What quarter has the largest spread of data? Third Fourth O Second First stics ort 39 d. What is that spread? e. Find the Inter Quartile Range (IQR): f. Which interval has the most data in it? 20 - 38 tor For O 10 - 20 3- 10 12 36 g. What value could represent the 53rd percentile? 20 011 53 05 Previous Q Search 4 L hp a
Step by Step Solution
There are 3 Steps involved in it

Get step-by-step solutions from verified subject matter experts