

Question: Consider the business cycle data in the Table below. Table Standard deviation (in %) Correlations of GDP with Variable X at different leads and
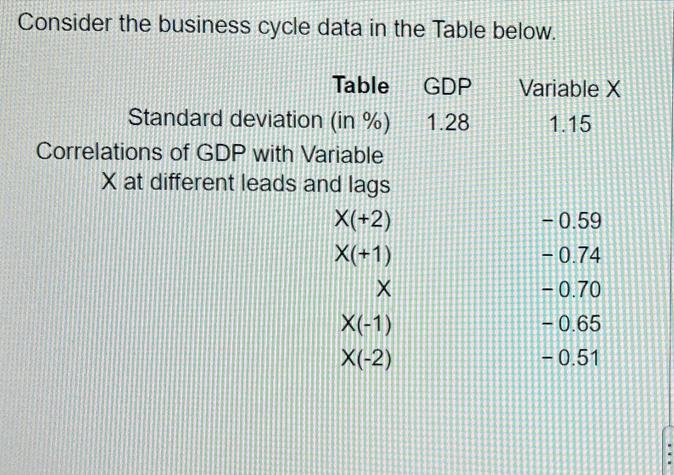
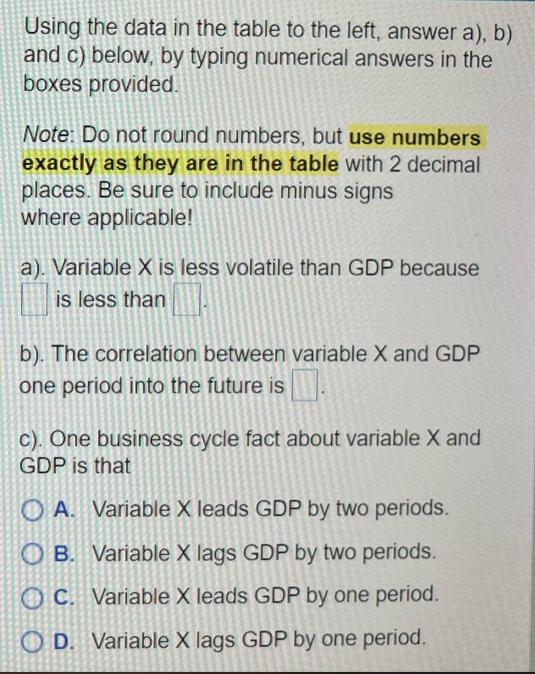
Consider the business cycle data in the Table below. Table Standard deviation (in %) Correlations of GDP with Variable X at different leads and lags X(+2) X(+1) X X(-1) X(-2) GDP 1.28 Variable X 1.15 -0.59 -0.74 -0.70 -0.65 -0.51 Using the data in the table to the left, answer a), b) and c) below, by typing numerical answers in the boxes provided. Note: Do not round numbers, but use numbers exactly as they are in the table with 2 decimal places. Be sure to include minus signs where applicable! a). Variable X is less volatile than GDP because is less than b). The correlation between variable X and GDP one period into the future is. c). One business cycle fact about variable X and GDP is that OA. Variable X leads GDP by two periods. OB. Variable X lags GDP by two periods. OC. Variable X leads GDP by one period. OD. Variable X lags GDP by one period.
Step by Step Solution
3.44 Rating (144 Votes )
There are 3 Steps involved in it
The detailed answer for the above question is provided below Here are the answers to you... View full answer

Get step-by-step solutions from verified subject matter experts