

Question: Consider the chart, which shows some information regarding prices for certain stocks (Figure 4). Stock PPS EPS P/E Ratio PEG Ratio Earnings Growth Rate (as
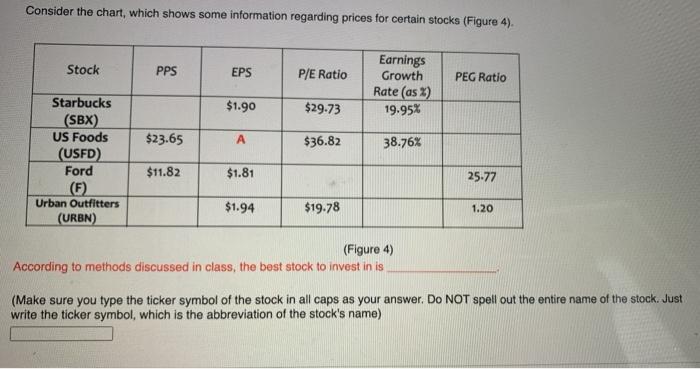
Consider the chart, which shows some information regarding prices for certain stocks (Figure 4). Stock PPS EPS P/E Ratio PEG Ratio Earnings Growth Rate (as 3) 19.95% $1.90 $29.73 $23.65 $36.82 38.76% Starbucks (SBX) US Foods (USED) Ford (6) Urban Outfitters (URBN) $11.82 $1.81 25.77 $1.94 $19.78 1.20 (Figure 4) According to methods discussed in class, the best stock to invest in is (Make sure you type the ticker symbol of the stock in all caps as your answer. Do NOT spell out the entire name of the stock. Just write the ticker symbol, which is the abbreviation of the stock's name)
Step by Step Solution
There are 3 Steps involved in it
1 Expert Approved Answer
Step: 1 Unlock

Question Has Been Solved by an Expert!
Get step-by-step solutions from verified subject matter experts
Step: 2 Unlock
Step: 3 Unlock