

Question: Consider the circuit in Figure 1 . able graph . model M NMOS Vto = 1 Kp = 1 m L = 1 u W
Consider the circuit in Figure
able
graph
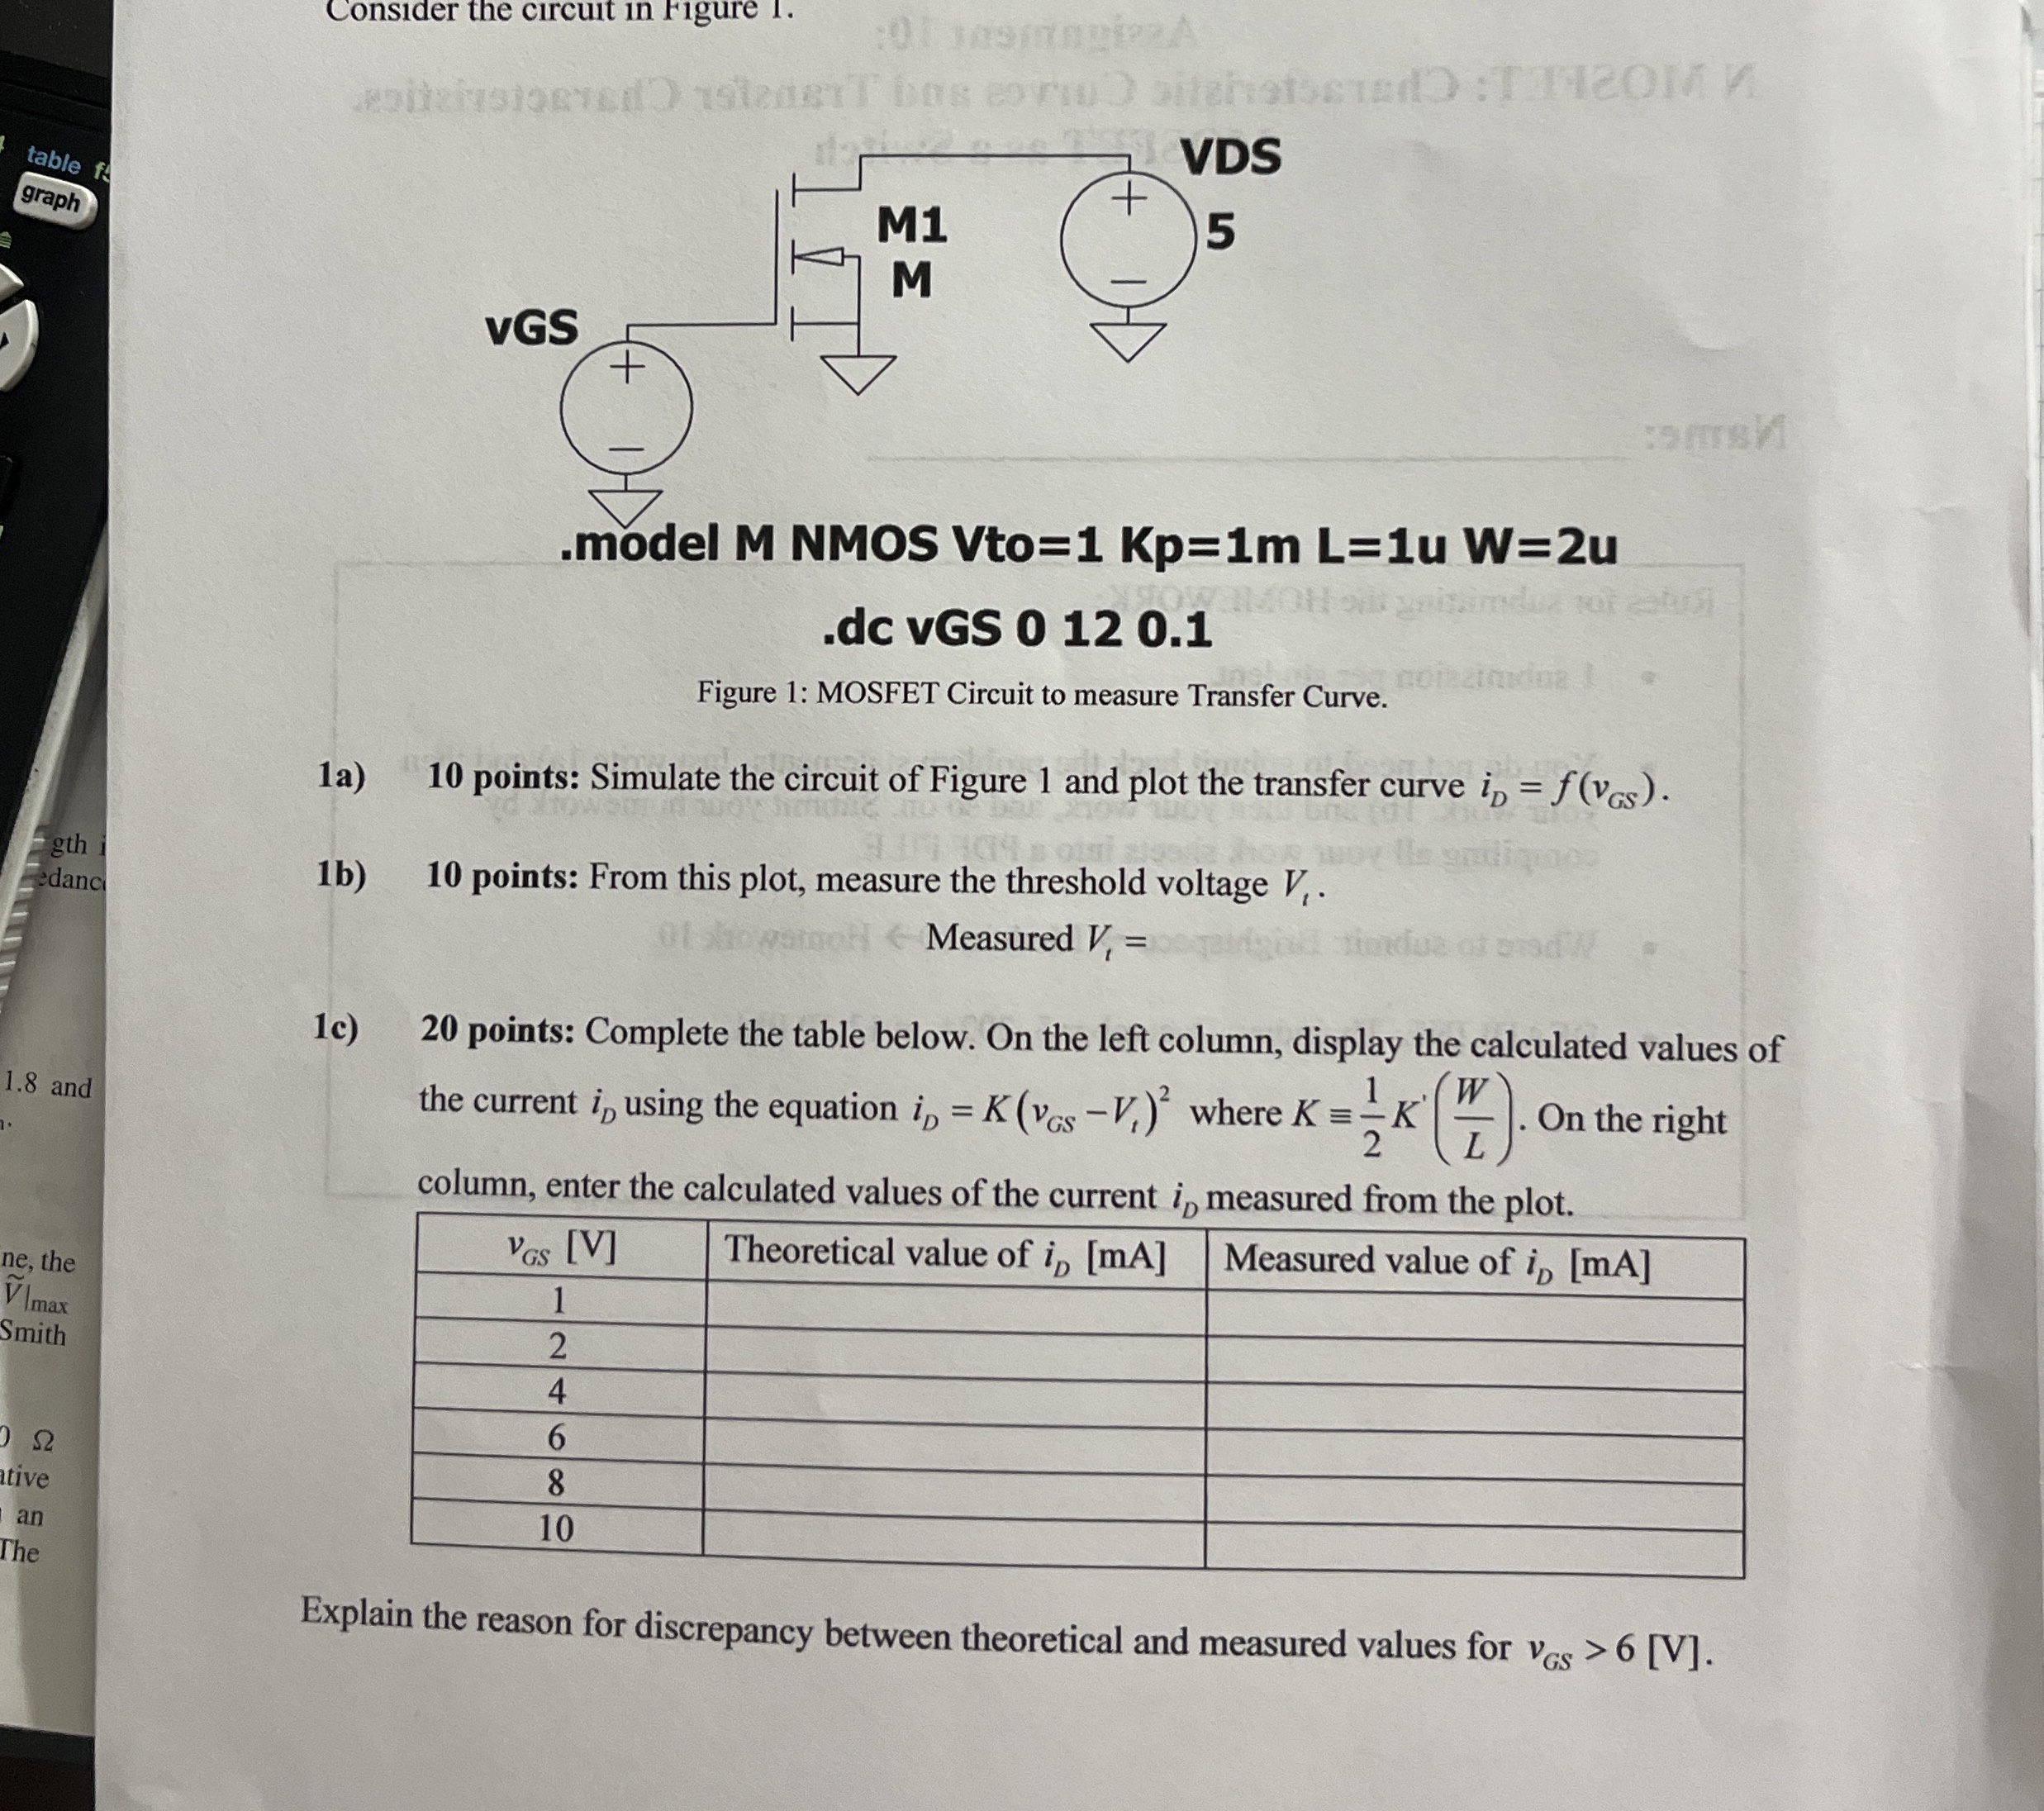
model M NMOS Vto Kpm Lu Wu dc VGS
Figure : MOSFET Circuit to measure Transfer Curve.
a points: Simulate the circuit of Figure and plot the transfer curve
b points: From this plot, measure the threshold voltage
Measured
c points: Complete the table below. On the left column, display the calculated values of the current using the equation where On the right column, enter the calculated values of the current measured from the plot.
tableTheoretical value of Measured value of
Step by Step Solution
There are 3 Steps involved in it
1 Expert Approved Answer
Step: 1 Unlock

Question Has Been Solved by an Expert!
Get step-by-step solutions from verified subject matter experts
Step: 2 Unlock
Step: 3 Unlock