

Question: Consider the coefficients table below which was generated as part of the analysis for this research: Coefficients Standardized Unstandardized Coefficients Coefficients 95.0% Confidence Interval for
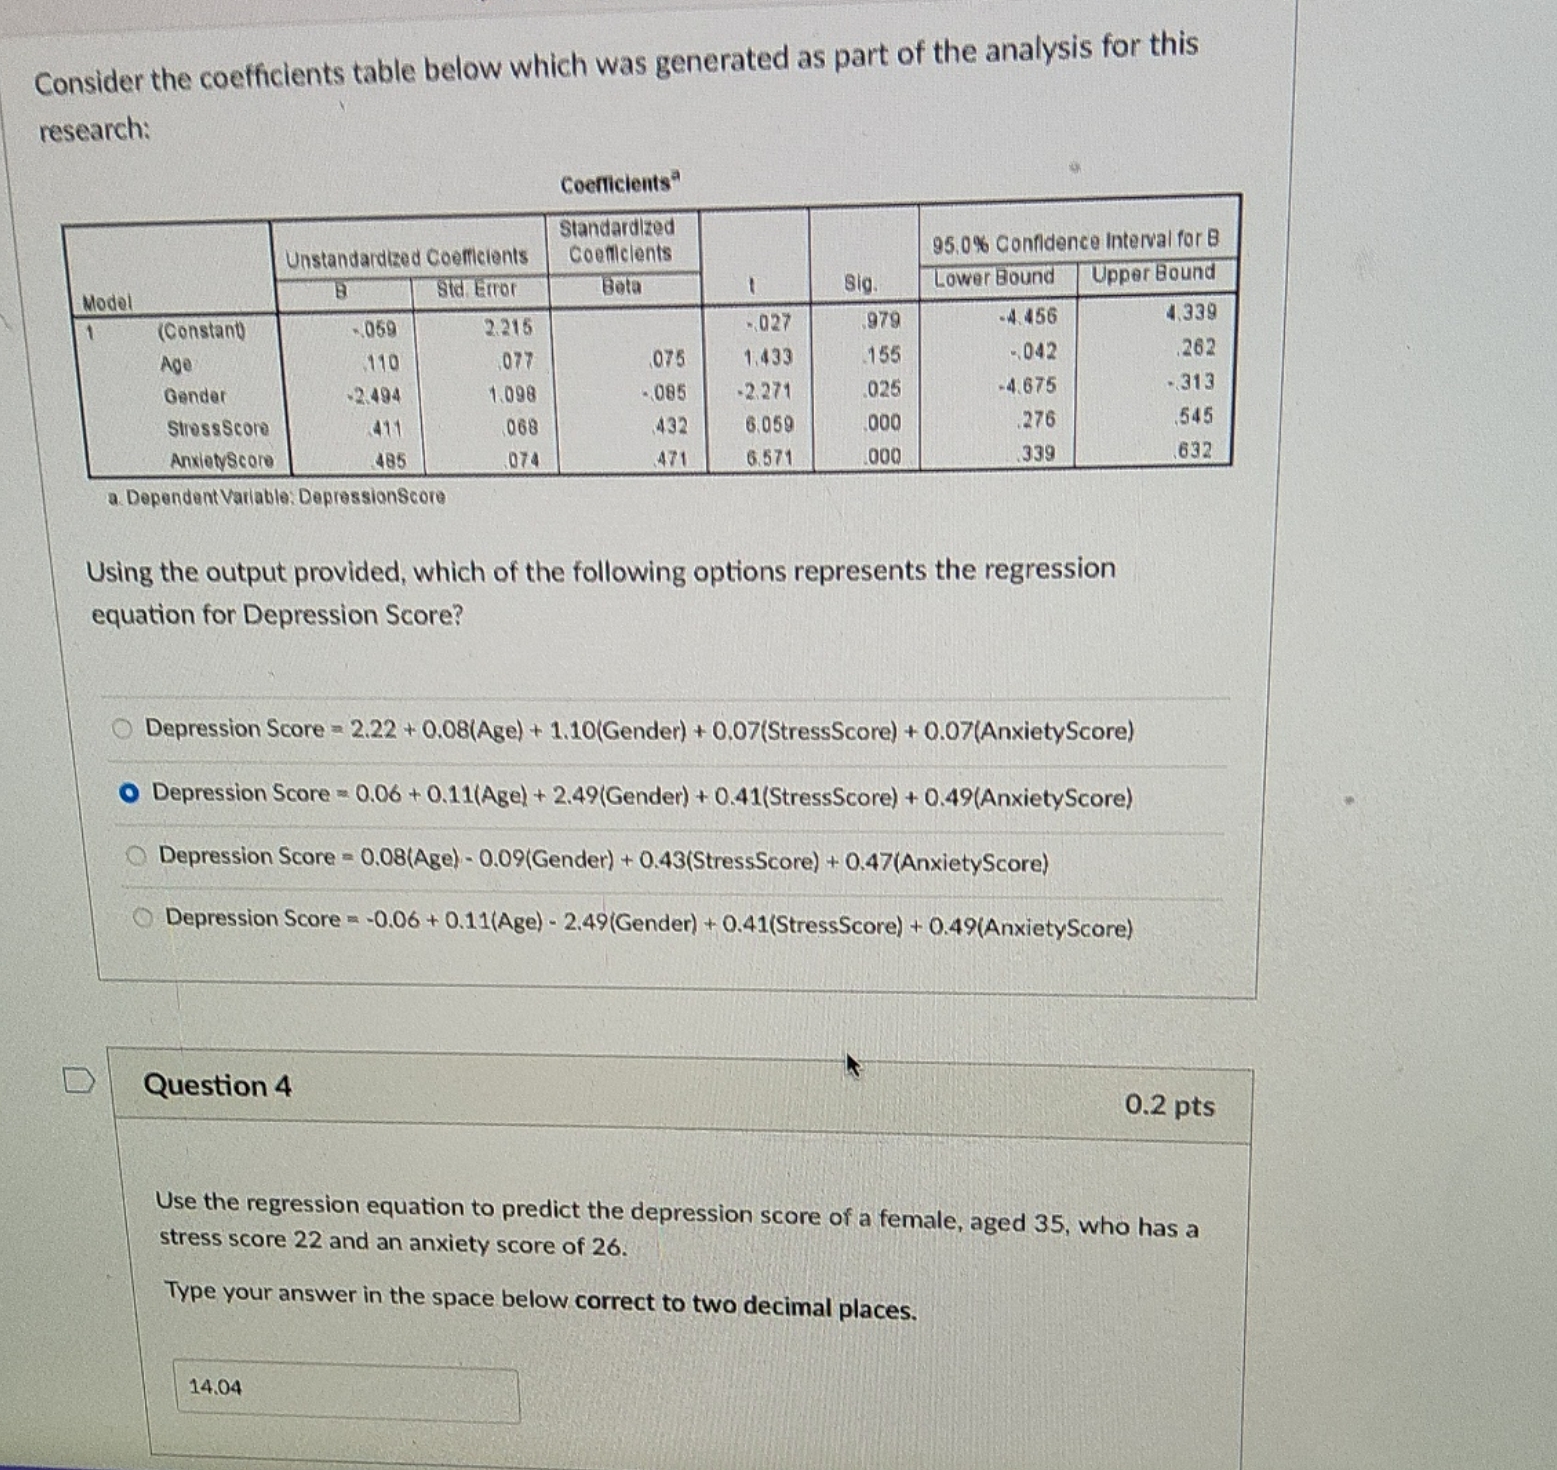
Consider the coefficients table below which was generated as part of the analysis for this research: Coefficients Standardized Unstandardized Coefficients Coefficients 95.0% Confidence Interval for B Sid Error Upper Bound Model Beta Sig Lower Bound (Constant) 059 2.215 027 979 4. 456 4.339 Age 110 077 075 1.433 155 042 262 Gender 2.494 1.098 085 -2.271 025 -4.675 -313 Stress Score 068 432 3.059 000 .276 545 AnxietyScore 485 074 6.57 000 339 632 Dependent Variable, DepressionScore Using the output provided, which of the following options represents the regression equation for Depression Score? Depression Score = 2.22 + 0.08(Age) + 1.10(Gender) + 0.07(StressScore) + 0.07(AnxietyScore) Depression Score = 0.06 + 0.11(Age) + 2.49(Gender) + 0.41(StressScore) + 0.49(AnxietyScore) Depression Score = 0.08(Age) - 0.09(Gender) + 0.43(StressScore) + 0.47(AnxietyScore) Depression Score = -0.06 + 0.11(Age) - 2.49(Gender) + 0.41(StressScore) + 0.49(AnxietyScore) D Question 4 0.2 pts Use the regression equation to predict the depression score of a female, aged 35, who has a stress score 22 and an anxiety score of 26. Type your answer in the space below correct to two decimal places. 14.04
Step by Step Solution
There are 3 Steps involved in it

Get step-by-step solutions from verified subject matter experts