

Question: Consider the contingency table below to test the independence between the distance from home to school and the school level. What is the expected frequency
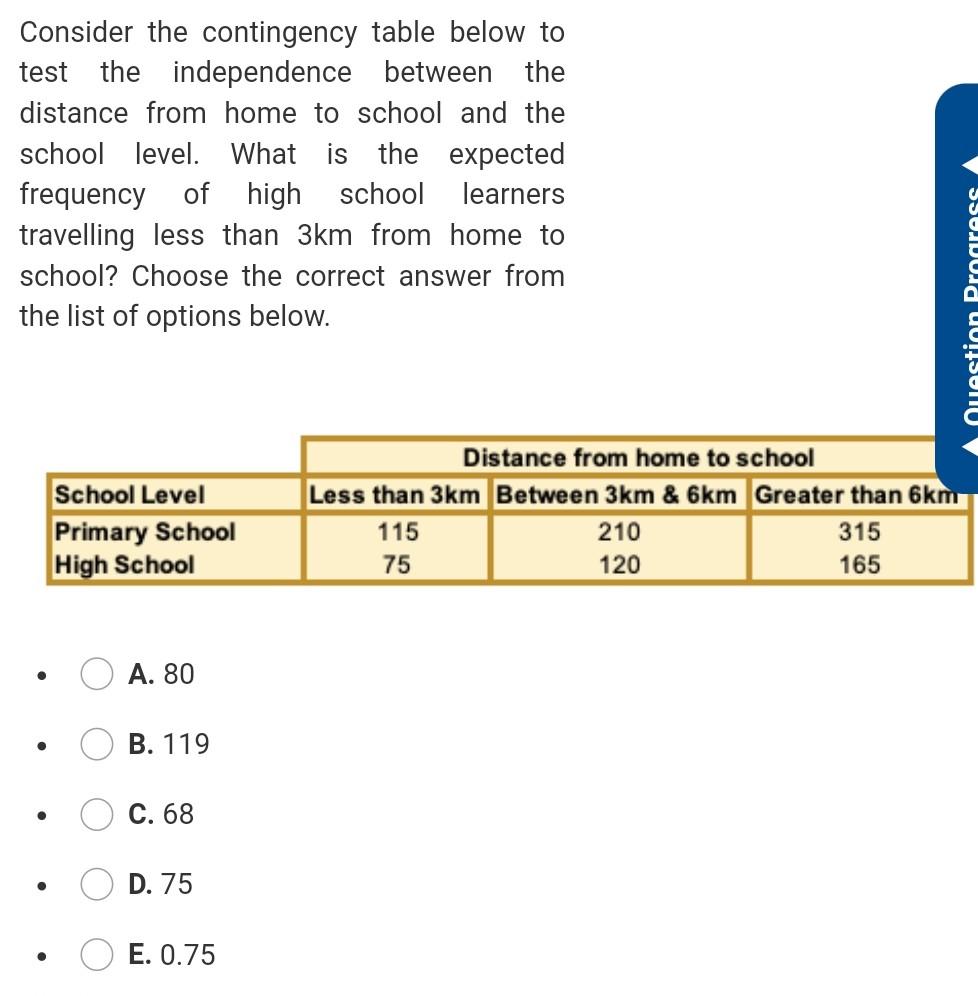
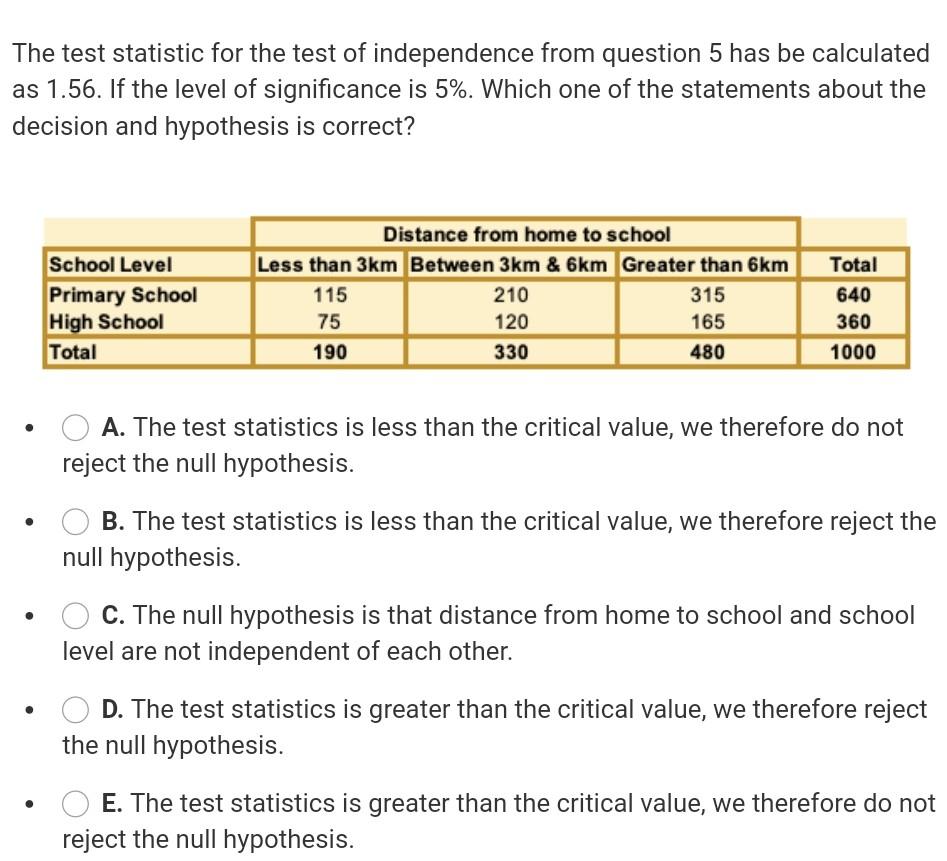
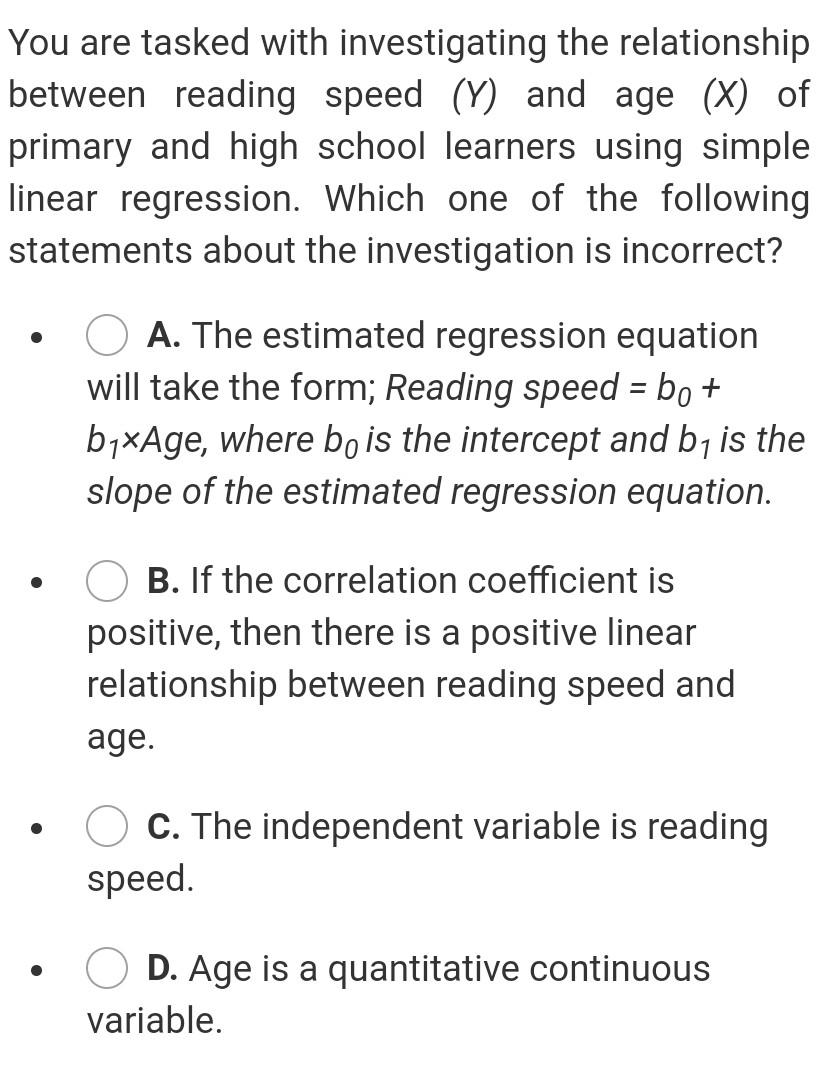
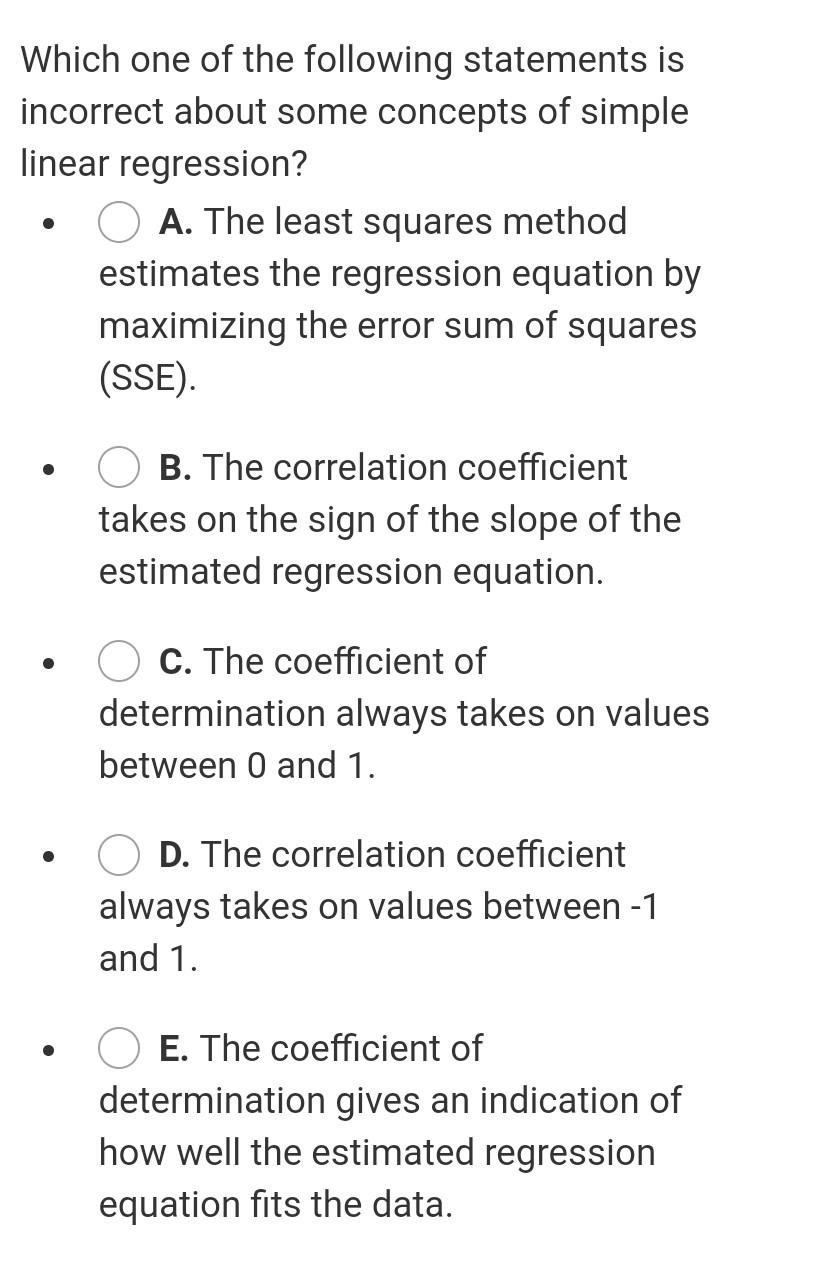
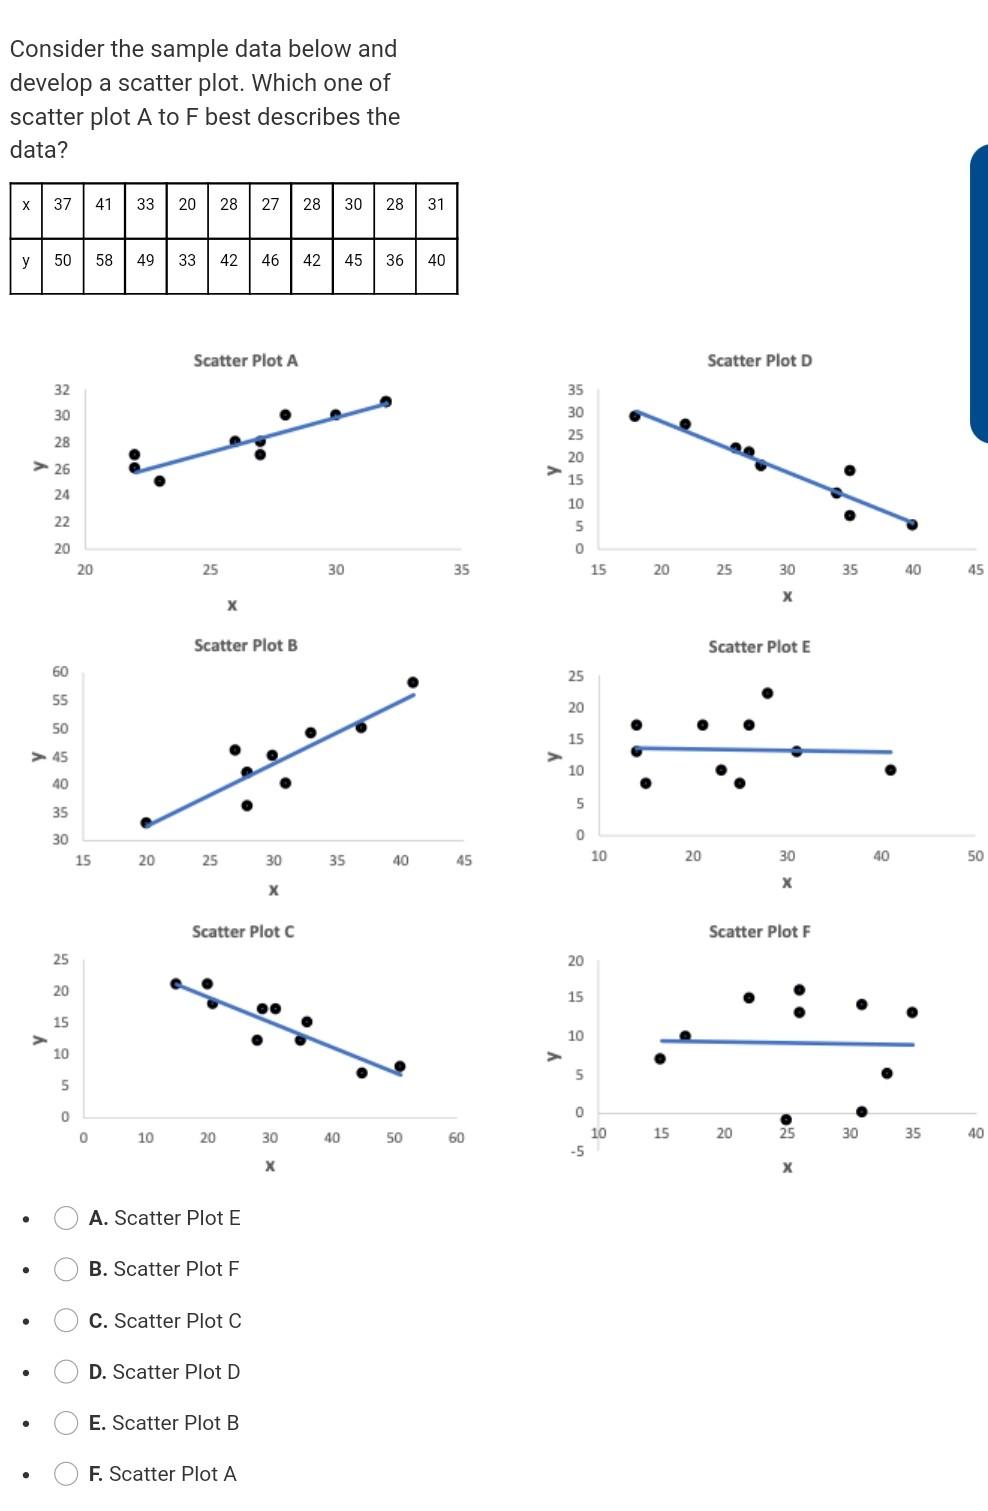
Consider the contingency table below to test the independence between the distance from home to school and the school level. What is the expected frequency of high school learners travelling less than 3km from home to school? Choose the correct answer from the list of options below. Question Progress School Level Primary School High School Distance from home to school Less than 3km Between 3km & 6km Greater than 6km 115 210 315 75 120 165 A. 80 B. 119 . C. 68 D. 75 . E. 0.75 The test statistic for the test of independence from question 5 has be calculated as 1.56. If the level of significance is 5%. Which one of the statements about the decision and hypothesis is correct? School Level Primary School High School Total Distance from home to school Less than 3km Between 3km & 6km Greater than 6km 115 210 315 75 120 165 190 330 480 Total 640 360 1000 . A. The test statistics is less than the critical value, we therefore do not reject the null hypothesis. B. The test statistics is less than the critical value, we therefore reject the null hypothesis. C. The null hypothesis is that distance from home to school and school level are not independent of each other. D. The test statistics is greater than the critical value, we therefore reject the null hypothesis. E. The test statistics is greater than the critical value, we therefore do not reject the null hypothesis. You are tasked with investigating the relationship between reading speed (Y) and age (x) of primary and high school learners using simple linear regression. Which one of the following statements about the investigation is incorrect? A. The estimated regression equation will take the form; Reading speed = bo + byxAge, where bo is the intercept and b1 is the slope of the estimated regression equation. B. If the correlation coefficient is positive, then there is a positive linear relationship between reading speed and age. C. The independent variable is reading speed. D. Age is a quantitative continuous variable. Which one of the following statements is incorrect about some concepts of simple linear regression? A. The least squares method estimates the regression equation by maximizing the error sum of squares (SSE) B. The correlation coefficient takes on the sign of the slope of the estimated regression equation. . C. The coefficient of determination always takes on values between 0 and 1. D. The correlation coefficient always takes on values between-1 and 1. E. The coefficient of determination gives an indication of how well the estimated regression equation fits the data. Consider the sample data below and develop a scatter plot. Which one of scatter plot A to F best describes the data? 37 41 33 20 28 27 28 30 28 31 y 50 58 49 33 42 46 42 45 36 40 Scatter Plot A Scatter Plot D 32 35 30 30 25 28 26 20 15 24 10 22 20 20 5 0 15 25 30 35 20 25 30 35 40 45 X Scatter Plot B Scatter Plot E 60 25 55 20 50 15 45 > 10 40 5 35 0 30 15 20 25 30 35 40 45 10 20 30 40 50 Scatter Plot C Scatter Plot F 25 20 20 15 . 15 > 10 10 5 5 0 0 0 10 20 30 40 50 60 15 20 25 30 35 40 10 -5 X . A. Scatter Plot E . B. Scatter Plot F . C. Scatter Plot C D. Scatter Plot D . E. Scatter Plot B F. Scatter Plot A
Step by Step Solution
There are 3 Steps involved in it
1 Expert Approved Answer
Step: 1 Unlock

Question Has Been Solved by an Expert!
Get step-by-step solutions from verified subject matter experts
Step: 2 Unlock
Step: 3 Unlock