

Question: Consider the contour plot in Figure 9.8.2 of a 2-variable function f(x, y). 0 -1 -2 0. 50 -3 D -2 -1 0 1
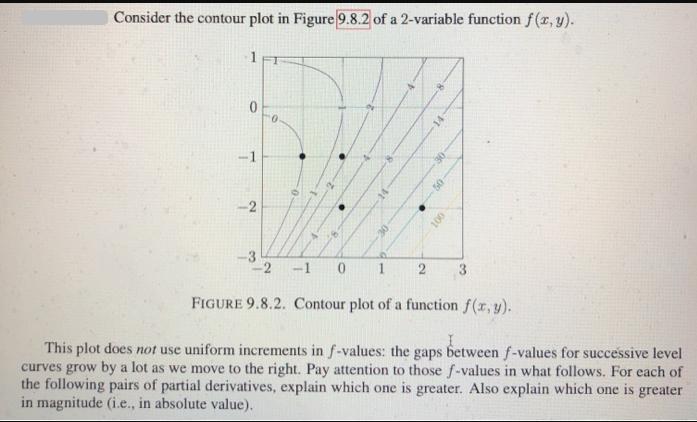
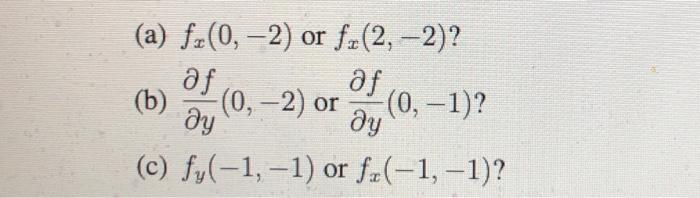
Consider the contour plot in Figure 9.8.2 of a 2-variable function f(x, y). 0 -1 -2 0. 50 -3 D -2 -1 0 1 2 3. FIGURE 9.8.2. Contour plot of a function f(x, y). This plot does not use uniform increments in f-values: the gaps between f-values for successive level curves grow by a lot as we move to the right. Pay attention to those f-values in what follows. For each of the following pairs of partial derivatives, explain which one is greater. Also explain which one is greater in magnitude (i.e., in absolute value). (a) fr(0,-2) or fr(2,-2)? af af (b) (0, -2) or (0, -1)? (c) fy(-1,-1) or fr (-1, -1)?
Step by Step Solution
There are 3 Steps involved in it

Get step-by-step solutions from verified subject matter experts