

Question: Consider the data contained in the table below, which lists 30 monthly excess returns to two different actively managed stock portfolios (A and 3 )
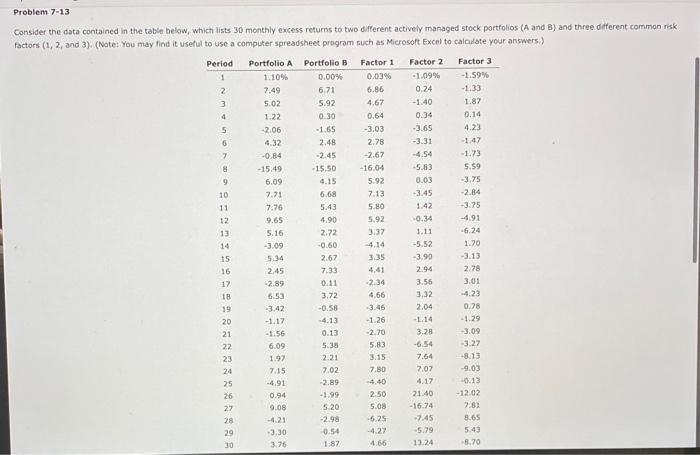
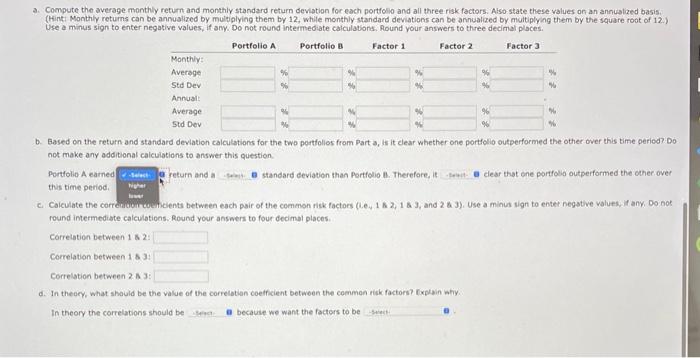
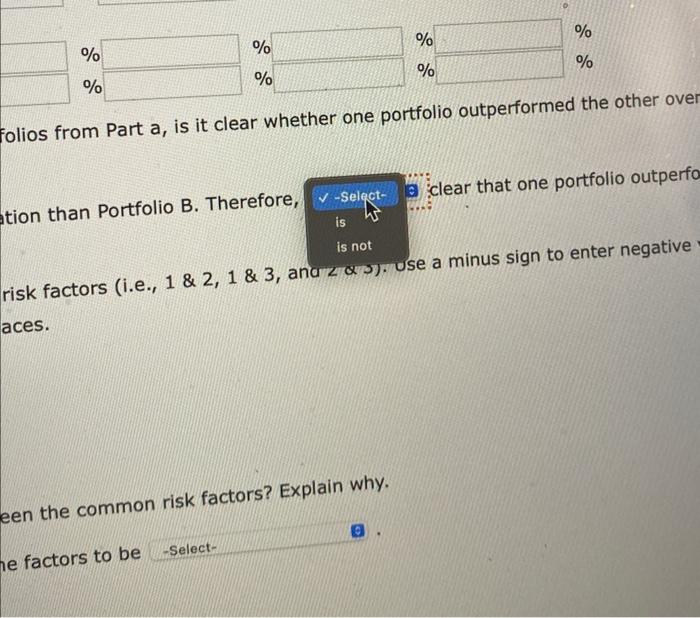
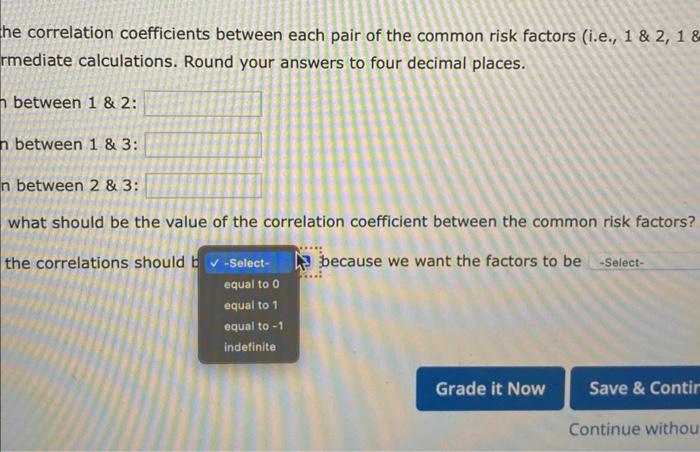
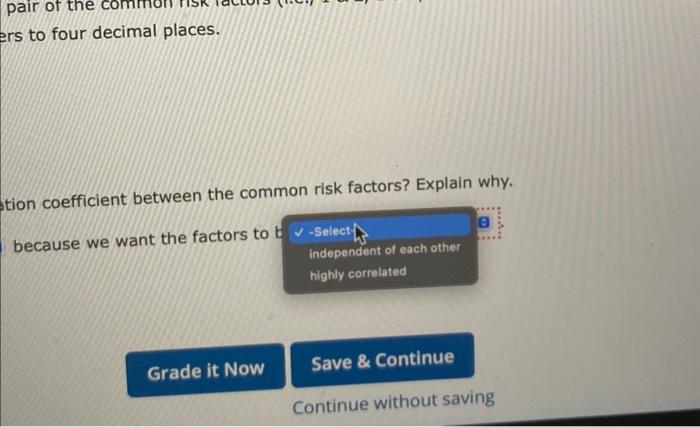
Consider the data contained in the table below, which lists 30 monthly excess returns to two different actively managed stock portfolios (A and 3 ) and three different comman risk factors (1, 2, and 3). (Note: You may find it usefial th nen a mamnitar wnreartcheet arnaram such as Microsoft Excel to calculate your answers.) 3. Compute the average monthily return and monthly standard return oeviation foc each portfolio and all three risk factors. Also state these values on an annuialized basis. (Hint Monthly retums can be annualized by mulvilying them by 12 , whlle monthly standard deviations can be annualixed by multiplying them by the square root of 12 .) Use a minus sign to enter negative values, if any, Do not round intermediate calculations. Round your answers to three decimal places. b. Based on the return and standard deviation calculations for the two portfolios from Part a, is it clear whether one portfollo outperformed the other over this time period? Do not make any additional calculations to answer this question. Portfolio A earned standard deviation than Portfolio it. Therefore, it Clear that one portfolio outperformed the other over this time period. c. Caiculate the correuromrcoencienti between each pair of the common rik factors (i.e., 1k2,183, and 2b3 ), Use a minus sign to enter negstive values, if any, Do nok round intermediate calculations. Round your answers to four decimal places. Correlation between 1 \& 2: Correlation between 1 s 3: Correlation between 2.N3 : d. In theory, what shauld be the value of the correlotian coeificient botwoen the common risk factors? fxplain whiy. In theory the correlations should be becave we want the factors to be \begin{tabular}{llllll} rerage & % & % & % & % \\ d Dev & % & % & % & % \\ inual: & %rage & % & % & % \\ d Dev & % & % & % & % \\ & % & % & % & % \\ \hline \end{tabular} eviation calculations for the two portfolios from Part a, is it clear whether one portfolio out to answer this question. standard deviation than Portfolio B. Therefore, it betweentedct pant of the common risk factors (i.e., 1&2,1&3, and 2&3 ). Use a minus and your answers to four decimal places. of the correlation coefficient between the common risk factors? Explain why. because we want the factors to be %%%%%%%% folios from Part a, is it clear whether one portfolio outperformed the other ove tion than Portfolio B. Therefore, Clear that one portfolio outperfo risk factors (i.e., 1 \& 2,1 \& 3 , ana 2 \& . use a minus sign to enter negative aces. een the common risk factors? Explain why. he factors to be he correlation coefficients between each pair of the common risk factors (i.e., 1&2,18 mediate calculations. Round your answers to four decimal places. between 1 \& 2: between 1&3 between 2 \& 3: what should be the value of the correlation coefficient between the common risk factors? the correlations should because we want the factors to be ers to four decimal places. tion coefficient between the common risk factors? Explain why. because we want the factors to t Continue without saving Consider the data contained in the table below, which lists 30 monthly excess returns to two different actively managed stock portfolios (A and 3 ) and three different comman risk factors (1, 2, and 3). (Note: You may find it usefial th nen a mamnitar wnreartcheet arnaram such as Microsoft Excel to calculate your answers.) 3. Compute the average monthily return and monthly standard return oeviation foc each portfolio and all three risk factors. Also state these values on an annuialized basis. (Hint Monthly retums can be annualized by mulvilying them by 12 , whlle monthly standard deviations can be annualixed by multiplying them by the square root of 12 .) Use a minus sign to enter negative values, if any, Do not round intermediate calculations. Round your answers to three decimal places. b. Based on the return and standard deviation calculations for the two portfolios from Part a, is it clear whether one portfollo outperformed the other over this time period? Do not make any additional calculations to answer this question. Portfolio A earned standard deviation than Portfolio it. Therefore, it Clear that one portfolio outperformed the other over this time period. c. Caiculate the correuromrcoencienti between each pair of the common rik factors (i.e., 1k2,183, and 2b3 ), Use a minus sign to enter negstive values, if any, Do nok round intermediate calculations. Round your answers to four decimal places. Correlation between 1 \& 2: Correlation between 1 s 3: Correlation between 2.N3 : d. In theory, what shauld be the value of the correlotian coeificient botwoen the common risk factors? fxplain whiy. In theory the correlations should be becave we want the factors to be \begin{tabular}{llllll} rerage & % & % & % & % \\ d Dev & % & % & % & % \\ inual: & %rage & % & % & % \\ d Dev & % & % & % & % \\ & % & % & % & % \\ \hline \end{tabular} eviation calculations for the two portfolios from Part a, is it clear whether one portfolio out to answer this question. standard deviation than Portfolio B. Therefore, it betweentedct pant of the common risk factors (i.e., 1&2,1&3, and 2&3 ). Use a minus and your answers to four decimal places. of the correlation coefficient between the common risk factors? Explain why. because we want the factors to be %%%%%%%% folios from Part a, is it clear whether one portfolio outperformed the other ove tion than Portfolio B. Therefore, Clear that one portfolio outperfo risk factors (i.e., 1 \& 2,1 \& 3 , ana 2 \& . use a minus sign to enter negative aces. een the common risk factors? Explain why. he factors to be he correlation coefficients between each pair of the common risk factors (i.e., 1&2,18 mediate calculations. Round your answers to four decimal places. between 1 \& 2: between 1&3 between 2 \& 3: what should be the value of the correlation coefficient between the common risk factors? the correlations should because we want the factors to be ers to four decimal places. tion coefficient between the common risk factors? Explain why. because we want the factors to t Continue without saving
Step by Step Solution
There are 3 Steps involved in it

Get step-by-step solutions from verified subject matter experts