

Question: Consider the data in the following table for the years 1 9 6 9 and 1 9 7 0 ( where the values for real
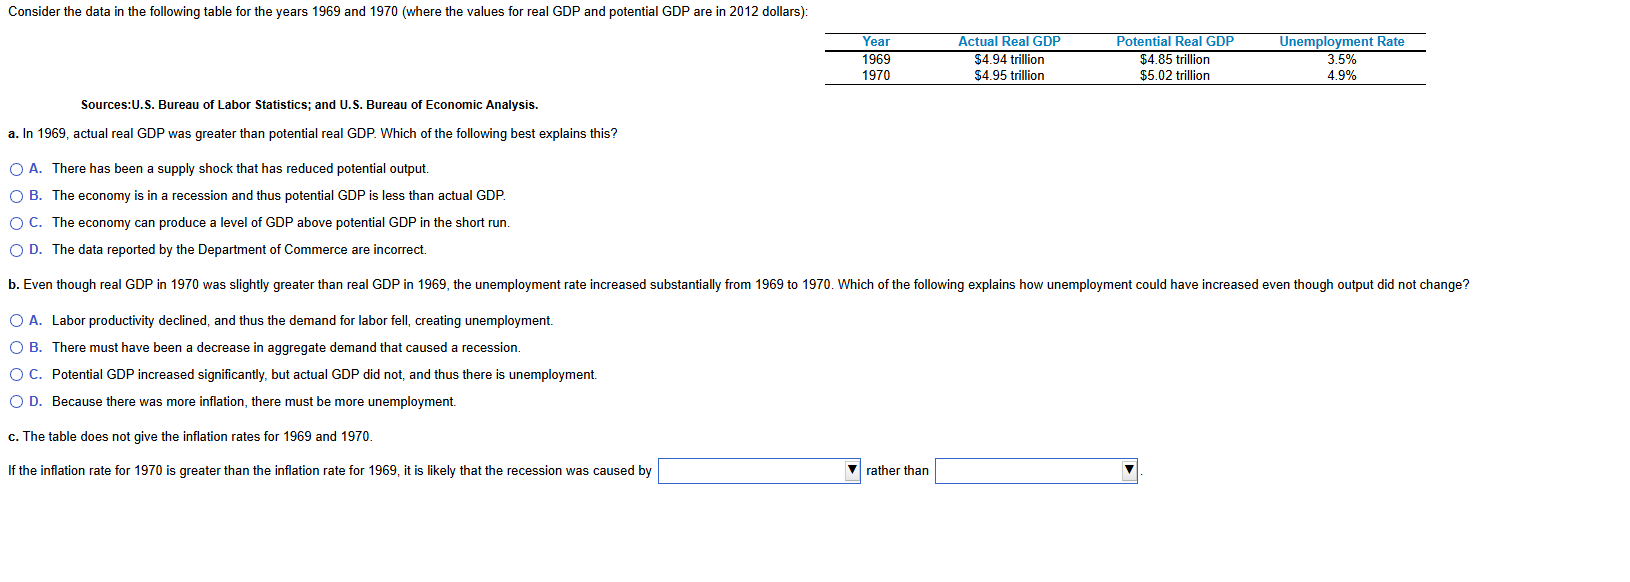
Consider the data in the following table for the years and where the values for real GDP and potential GDP are in dollars:
Sources:US Bureau of Labor Statistics; and US Bureau of Economic Analysis.
a In actual real GDP was greater than potential real GDP Which of the following best explains this?
A There has been a supply shock that has reduced potential output.
B The economy is in a recession and thus potential GDP is less than actual GDP
C The economy can produce a level of GDP above potential GDP in the short run.
D The data reported by the Department of Commerce are incorrect.
A Labor productivity declined, and thus the demand for labor fell, creating unemployment.
B There must have been a decrease in aggregate demand that caused a recession.
C Potential GDP increased significantly, but actual GDP did not, and thus there is unemployment.
D Because there was more inflation, there must be more unemployment.
c The table does not give the inflation rates for and
If the inflation rate for is greater than the inflation rate for it is likely that the recession was caused by rather than
Step by Step Solution
There are 3 Steps involved in it
1 Expert Approved Answer
Step: 1 Unlock

Question Has Been Solved by an Expert!
Get step-by-step solutions from verified subject matter experts
Step: 2 Unlock
Step: 3 Unlock