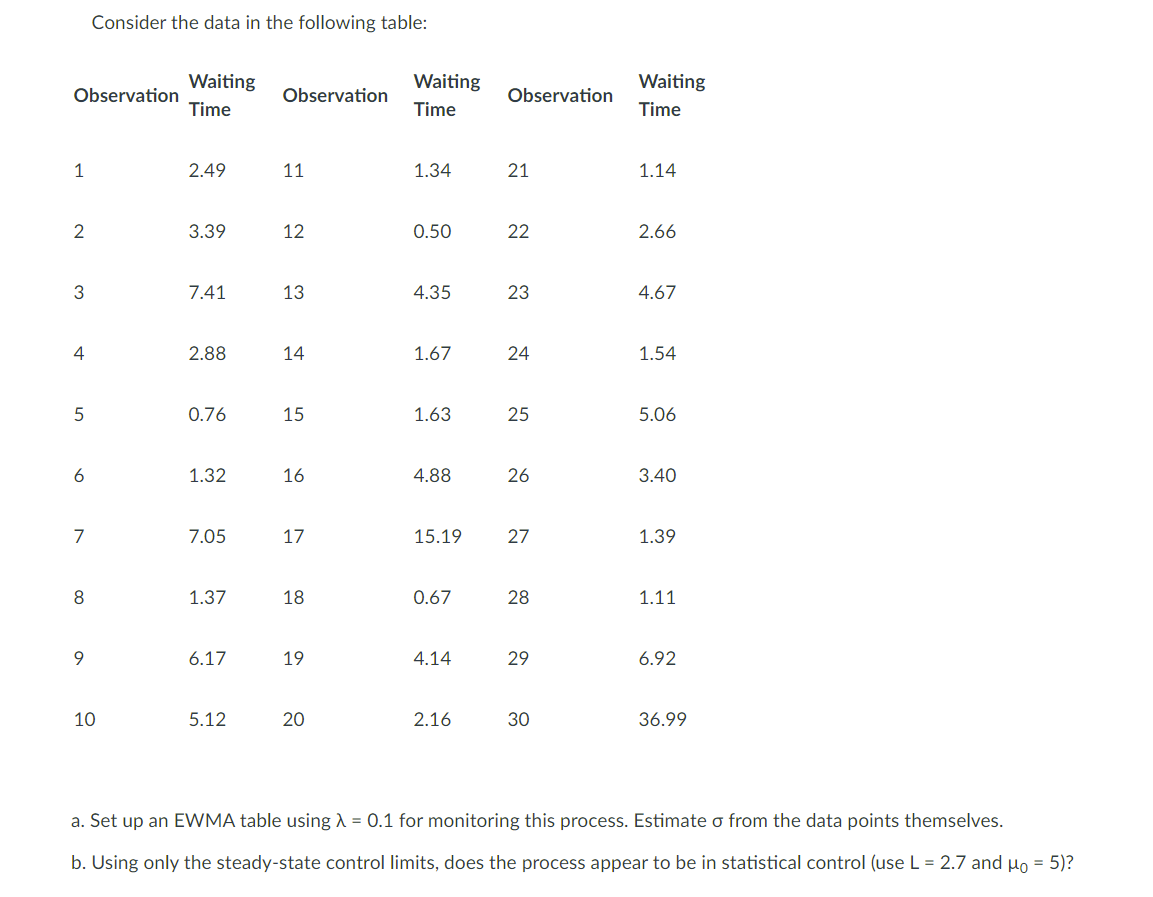
Question: Consider the data in the following table: Observation Waiting Time Observation Waiting Time Observation Waiting Time 1 2.49 11 1.34 21 1.14 2 3.39 12

Consider the data in the following table:

Consider the data in the following table: Observation Waiting Time Observation Waiting Time Observation Waiting Time 1 2.49 11 1.34 21 1.14 2 3.39 12 0.50 22 2.66 3 7.41 13 4.35 23 4.67 4 2.88 14 1.67 24 1.54 5 0.76 15 1.63 25 5.06 6 1.32 16 4.88 26 3.40 7 7.05 17 15.19 27 1.39 8 1.37 18 0.67 28 1.11 9 6.17 19 4.14 29 6.92 10 5.12 20 2.16 30 36.99 a. Set up an EWMA table using 1 = 0.1 for monitoring this process. Estimate o from the data points themselves. b. Using only the steady-state control limits, does the process appear to be in statistical control (use L = 2.7 and Mo = 5)

Step by Step Solution

There are 3 Steps involved in it

1 Expert Approved Answer
Step: 1 Unlock blur-text-image
Question Has Been Solved by an Expert!

Get step-by-step solutions from verified subject matter experts

Step: 2 Unlock
Step: 3 Unlock

Students Have Also Explored These Related General Management Questions!