

Question: Consider the data in the table below. (All real output numbers are in billions S): Agg. Demand @ Full Price Index Aga. Supply (AS) Employment
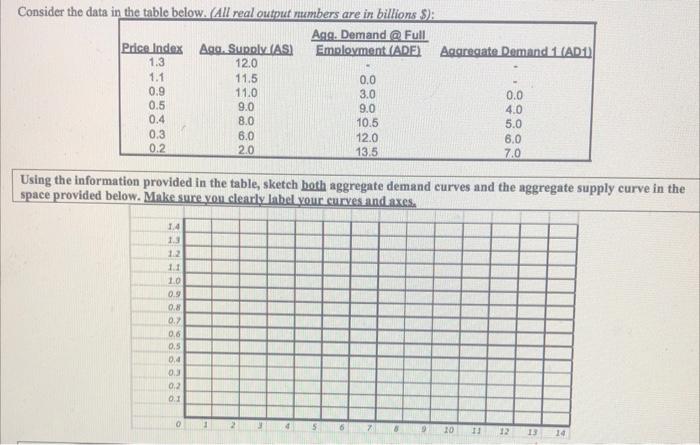

Consider the data in the table below. (All real output numbers are in billions S): Agg. Demand @ Full Price Index Aga. Supply (AS) Employment (ADE) Aggregate Demand 1 (AD1) 1.3 12.0 1.1 11.5 0.0 0.9 1.1.0 3.0 0.0 0.5 9.0 9.0 4.0 0.4 8.0 10.5 5.0 0.3 6.0 12.0 6.0 0.2 2.0 13.5 7.0 Using the information provided in the table, sketch both aggregate demand curves and the aggregate supply curve in the space provided below. Make sure you clearly label your curves and axes. 1.2 1.1 10 2 10 13 12 13 14
Step by Step Solution
There are 3 Steps involved in it
1 Expert Approved Answer
Step: 1 Unlock

Question Has Been Solved by an Expert!
Get step-by-step solutions from verified subject matter experts
Step: 2 Unlock
Step: 3 Unlock