

Question: Consider the data on the right. (a) Draw a scatter diagram of the data and compute the linear correlation coefficient. (b) Draw a scatter diagram
Consider the data on the right. (a) Draw a scatter diagram of the data and compute the linear correlation coefficient. (b) Draw a scatter diagram of the data and compute the linear correlation coefficient with the additional data point left parenthesis 10.5 comma 9.2 right parenthesis.
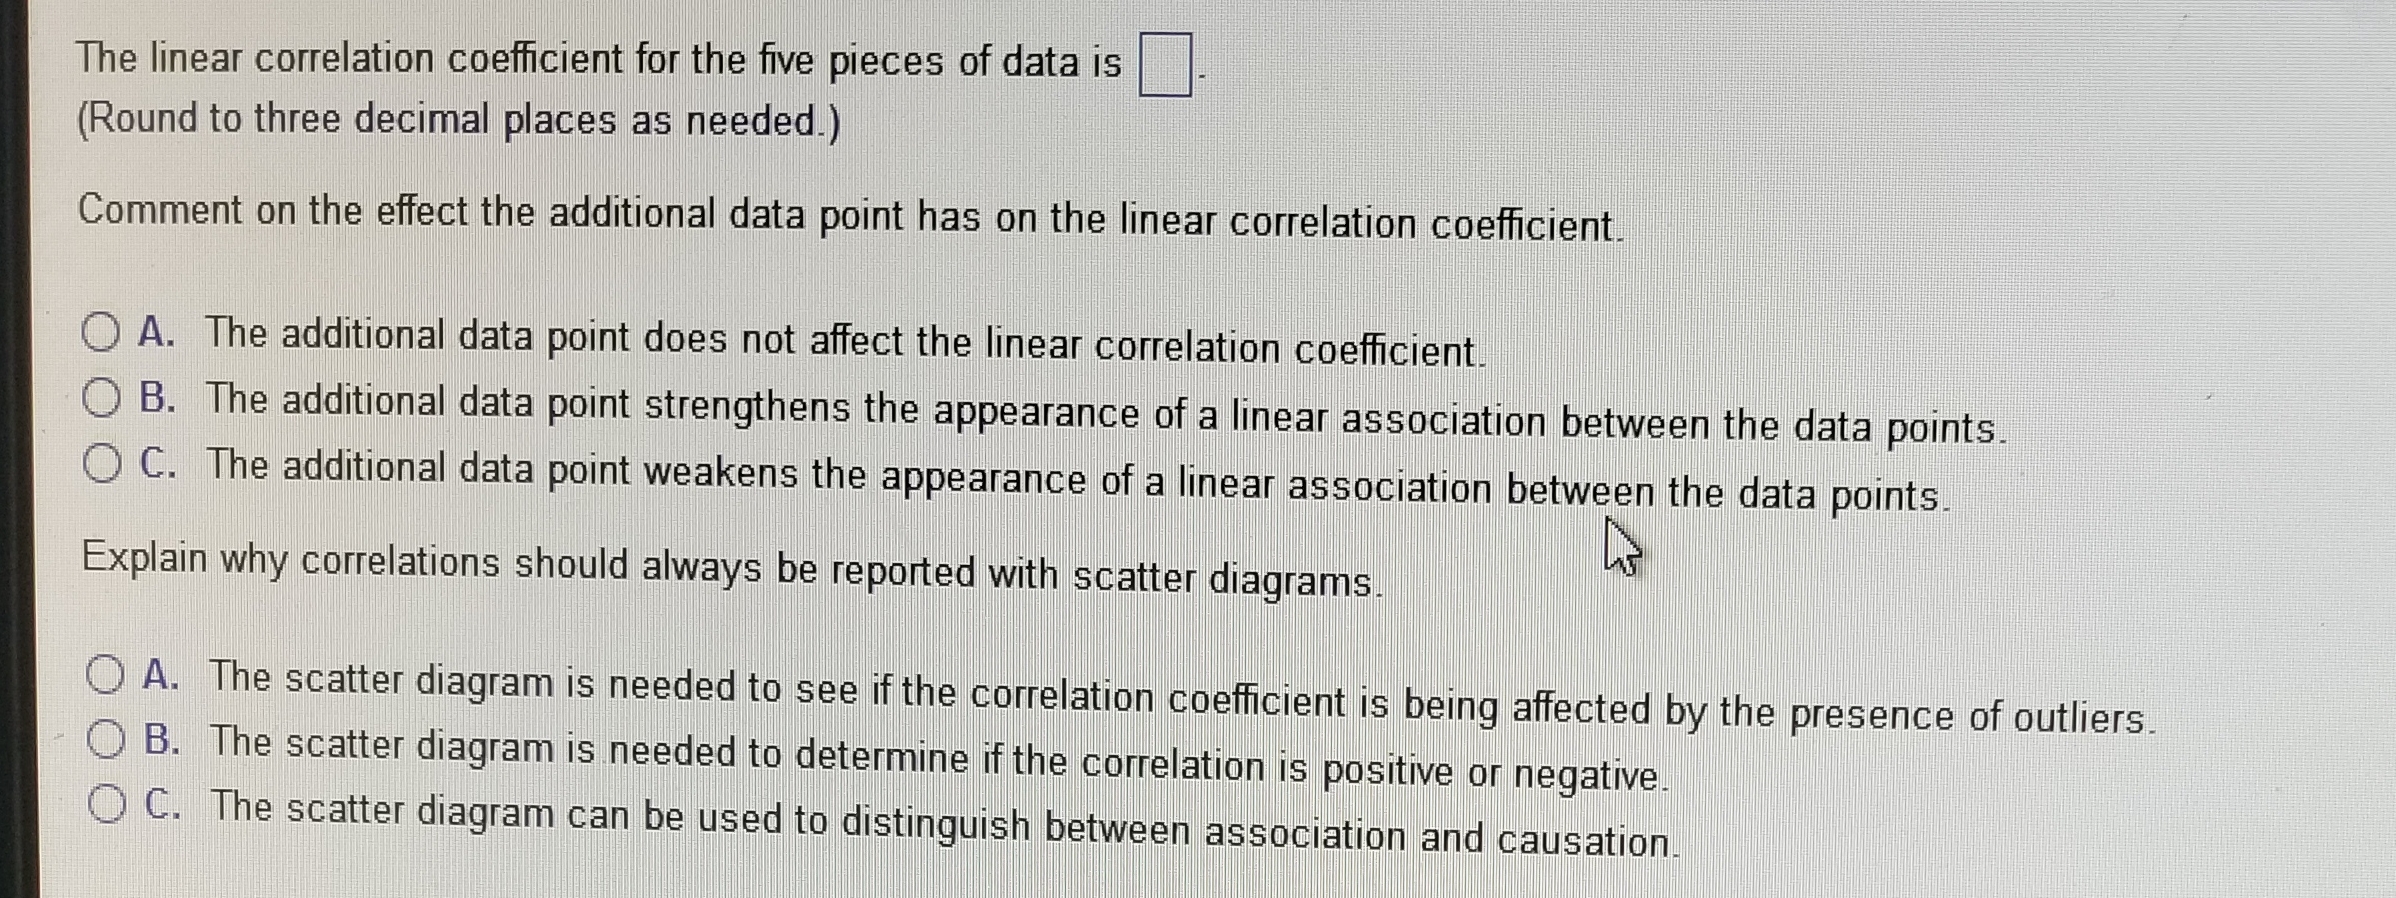
Comment on the effect the additional data point has on the linear correlation coefficient. Explain why correlations should always be reported with scatter diagrams.

\f\f
Step by Step Solution
There are 3 Steps involved in it
1 Expert Approved Answer
Step: 1 Unlock

Question Has Been Solved by an Expert!
Get step-by-step solutions from verified subject matter experts
Step: 2 Unlock
Step: 3 Unlock