

Question: Consider the data shown: 36 49 88 19 28 106 61 83 44 23 94 34 39 68 72 79 50 Find the five-number
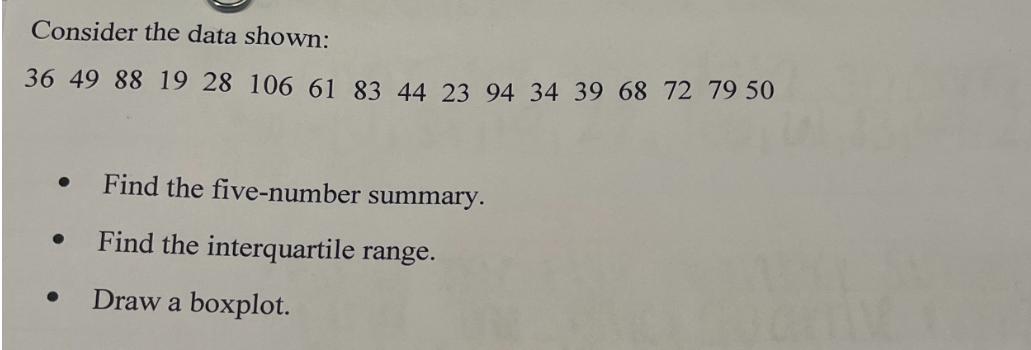
Consider the data shown: 36 49 88 19 28 106 61 83 44 23 94 34 39 68 72 79 50 Find the five-number summary. Find the interquartile range. Draw a boxplot.
Step by Step Solution
There are 3 Steps involved in it
1 Expert Approved Answer
Step: 1 Unlock

Question Has Been Solved by an Expert!
Get step-by-step solutions from verified subject matter experts
Step: 2 Unlock
Step: 3 Unlock