

Question: Consider the dependency matrix and the activity durations provided below. a. Which of the following graphs visually depict the evolution of this project. Option 1:
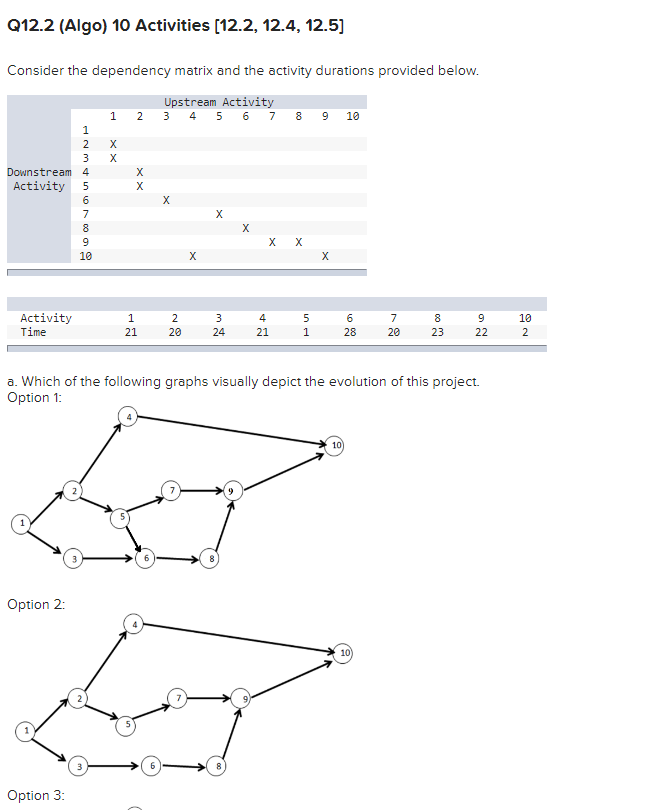
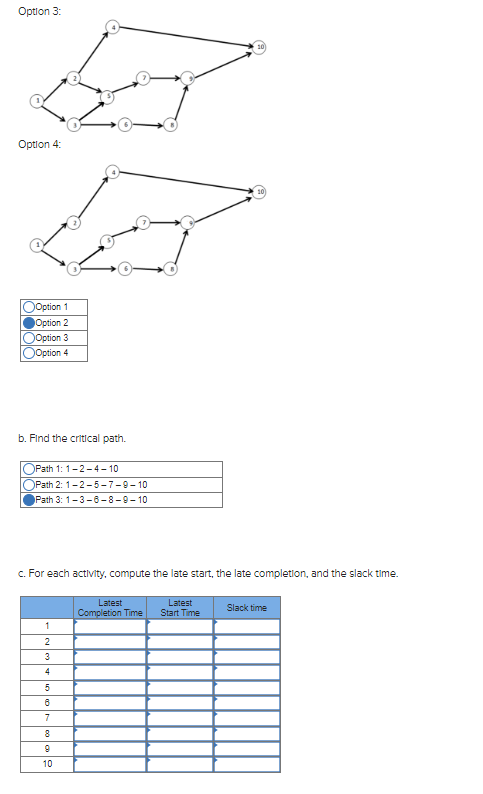
Consider the dependency matrix and the activity durations provided below. a. Which of the following graphs visually depict the evolution of this project. Option 1: Uption 5 : nominn 2. \begin{tabular}{|c|} \hline 1Option 1 \\ \hline Option 2 \\ \hline Option 3 \\ \hline Option 4 \\ \hline \end{tabular} b. Find the critical path. c. For each actlvity, compute the late start, the late completion, and the slack time
Step by Step Solution
There are 3 Steps involved in it
1 Expert Approved Answer
Step: 1 Unlock

Question Has Been Solved by an Expert!
Get step-by-step solutions from verified subject matter experts
Step: 2 Unlock
Step: 3 Unlock