

Question: Consider the equation f(x) = cos(x) - ln(x) + ex^2 that exists over the interval x elementof [0, pi]. For our purposes, we hope to
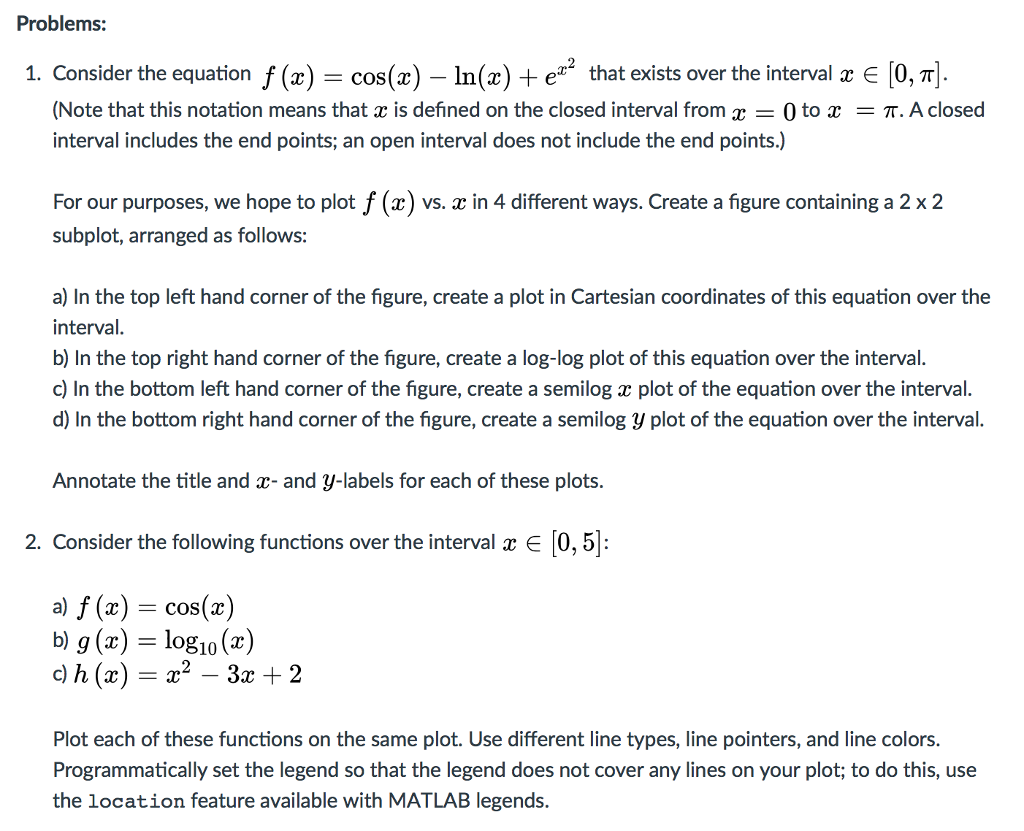
Consider the equation f(x) = cos(x) - ln(x) + ex^2 that exists over the interval x elementof [0, pi]. For our purposes, we hope to plot f(x) vs. x in 4 different ways. Create a figure containing a 2 x 2 subplot, arranged as follows: a) In the top left hand corner of the figure, create a plot in Cartesian coordinates of this equation over the interval. b) In the top right hand corner of the figure, create a log-log plot of this equation over the interval. c) In the bottom left hand corner of the figure, create a semilog x plot of the equation over the interval. d) In the bottom right hand corner of the figure, create a semilog y plot of the equation over the interval. Annotate the title and x- and y-labels for each of these plots. Consider the following functions over the interval x elementof [0, 5]: a) f(x) = cos(x) b) g(x) = log_10(x) c) h(x) = x^2 - 3x + 2 Plot each of these functions on the same plot. Use different line types, line pointers, and line colors. Programmatically set the legend so that the legend does not cover any lines on your plot; to do this, use the location feature available with MATLAB legends. Consider the equation f(x) = cos(x) - ln(x) + ex^2 that exists over the interval x elementof [0, pi]. For our purposes, we hope to plot f(x) vs. x in 4 different ways. Create a figure containing a 2 x 2 subplot, arranged as follows: a) In the top left hand corner of the figure, create a plot in Cartesian coordinates of this equation over the interval. b) In the top right hand corner of the figure, create a log-log plot of this equation over the interval. c) In the bottom left hand corner of the figure, create a semilog x plot of the equation over the interval. d) In the bottom right hand corner of the figure, create a semilog y plot of the equation over the interval. Annotate the title and x- and y-labels for each of these plots. Consider the following functions over the interval x elementof [0, 5]: a) f(x) = cos(x) b) g(x) = log_10(x) c) h(x) = x^2 - 3x + 2 Plot each of these functions on the same plot. Use different line types, line pointers, and line colors. Programmatically set the legend so that the legend does not cover any lines on your plot; to do this, use the location feature available with MATLAB legends
Step by Step Solution
There are 3 Steps involved in it

Get step-by-step solutions from verified subject matter experts