

Question: Consider the exhibit below (Exhibit 1) Exhibit 1 Monthly excess returns Period Portfolio BTF Portfolio ETA 1 2 3 4 5 6 7 8
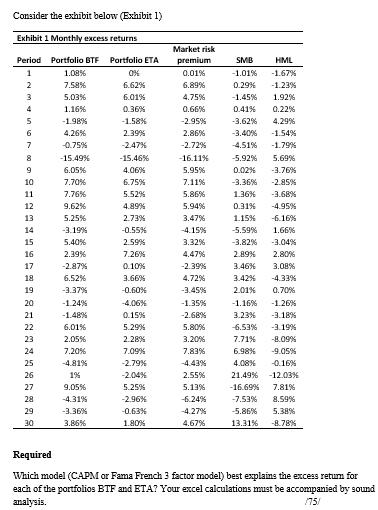
Consider the exhibit below (Exhibit 1) Exhibit 1 Monthly excess returns Period Portfolio BTF Portfolio ETA 1 2 3 4 5 6 7 8 9 10 HASHE2539222222222 11 12 13 14 15 16 17 18 19 20 21 24 26 27 28 30 1.08% 7.58% 5.03% 1.16% -1.98% 4.26% -0.75% -15.49% 6.05% 7.70% 7.76% 9.62% 5.25% -3.19 % 5.40% 2.39% -2.87% 6.52% -3.37% -1.24% -1.48% 6.01% 2.05% 7.20% -4.81% 1% 9.05% -4.31% -3.36% 3.86% 0% 6.62% 6.01% 0.36% -1.58% 2.39% -2.47% -15.46% 4.06% 6.75% 5.52% 4.89% 2.73% -0.55% 2.59% 7.26% 0.10% 3.66% -0.60% -4.06% 0.15% 5.29% 2.28% 7.09% -2.79% -2.04% 5.25% -2.96% -0.63% 1.80% Market risk premium 0.01% 6.89% 4.75% 0.66% -2.95% 2.86% -2.72% -16.11% 5.95% 7.11% 5.86% 5.94% 3.47% -4.15% 3.32% 4.47% -2.39% 4.72% -3.45% -1.35% -2.68% 5.80% 3.20% 7.83% -4.43% 2.55% 5.13% -6.24% -4.27% 4.67% SMB HML -1.01% -1.67% 0.29% -1.23% -1.45% 1.92% 0.41% 0.22% -3.62% 4.29% -3.40% -1.54% -4.51% -1.79% -5.92% 5.69% 0.02% -3.76% -3.36% -2.85% 1.36% -3.68% 0.31% -4.95% 1.15% -6.16% -5.59% 1.66% -3.82% -3.04% 2.89% 2.80% 3.46% 3.08% 3.42% -4.33% 2.01% 0.70% -1.16% 3.23% -1.26% -3.18% -6.53% -3.19% 7.71% -8.09% 6.98% -9.05% 4.08% -0.16% 21.49% -12.03% -16.69% 7.81% -7.53% 8.59% -5.86% 5.38% 13.31% -8.78% Required Which model (CAPM or Fama French 3 factor model) best explains the excess return for each of the portfolios BTF and ETA? Your excel calculations must be accompanied by sound analysis. /75/
Step by Step Solution
There are 3 Steps involved in it
To determine which model CAPM or Fama French 3 factor model best explains the excess return for each ... View full answer

Get step-by-step solutions from verified subject matter experts