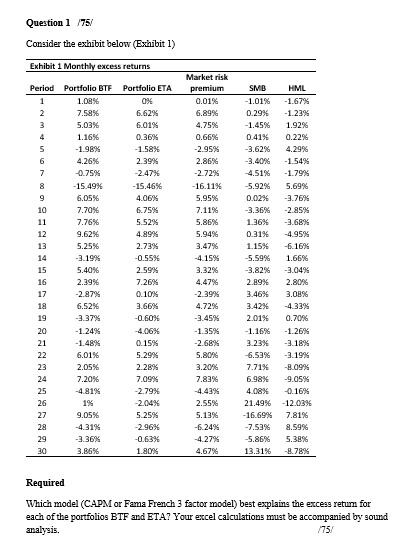
Question: Question 1 175/ Consider the exhibit below (Exhibit 1) Exhibit 1 Monthly excess returns Market risk Period Portfolio BTF Portfolio ETA premium SMD HIML 1.085E

Question 1 175/ Consider the exhibit below
Question 1 175/ Consider the exhibit below (Exhibit 1) Exhibit 1 Monthly excess returns Market risk Period Portfolio BTF Portfolio ETA premium SMD HIML 1.085E 0.01% -1.01% -1.6715 7.58% 6.6215 6.89% 0.29%% -1.2305 5.036 6.014 4.75% -1.45% 1.92% 1.16% 0.3615 0.66%% 0.41% 0.22% WOWRWNH -1.9815 -1.58% 2.9575 -3.62% 4.29% 4.26% 2.3919 2.86% -3.40% -1.545 0.7575 -2.47 -2.7295 -4.51%% -1.7975 -15.49% -15.46% -16.11% -5.92% 5.69% 9 6.0556 4.0615 5.95% -3.7615 10 7.70% 6.7515 7.11% -3.36% -2.8515 11 7.76% 5.5219 5.86%% 1.36% -3.6875 12 9.62% 4.8975 5.94% 0.31% -4.9515 13 5.25% 2.73%% 3.47% 1.15% -6.1615 14 -3.1975 -0.55% -4.1515 -5.59% 1.66%% 15 5.40% 2.5975 3.32% -3.82% -3.04% 16 2.395% 7.2615 4.47% 2 89% 2.80%6 17 2.87% 0.1015 -2.3975 3.46% 3.08% 18 6.52% 3.6615 4.72% 19 -3.37% -0.60% -3.4545 2.01% 0.70%% 20 -1.2415 -4.06% -1.3515 -1.16 -1.2615 21 -1.4875 0.1575 -2.6875 3.23% -3.1875 22 6.01% 5.2975 5.80%% -6.53% -3.1915 23 2.05% 2.2805 3.20%% 7.71% -8.0915 24 7.20% 7.0975 7.83% 6.98% -9.0515 -4.8145 -2.79% -4.4395 4 08% -0.1675 26 -2.04% 2.55% 21.49% -12 03% 27 9.0556 5.2505 5.13% -16.6915 7.81% 28 -4.3145 -2.96% -6.2475 -7.53% 8.59% 29 -3.361 -0.63% -4.2715 -5.86% 5.08% 30 3.86% 1.8015 4.67% 13.316 -8.7815 Required Which model (CAPM or Fame French 3 factor model) best explains the excess return for each of the portfolios BTF and ETA? Your excel calculations must be accompanied by sound amalysis. 1757

Step by Step Solution

There are 3 Steps involved in it

1 Expert Approved Answer
Step: 1 Unlock blur-text-image
Question Has Been Solved by an Expert!

Get step-by-step solutions from verified subject matter experts

Step: 2 Unlock
Step: 3 Unlock

Students Have Also Explored These Related Finance Questions!